Image Fusion
Introduction
This tutorial seeks to illustrate how image fusion can be conducted. We use an Unmanned Aerial Vehicle (UAV) and Sentinel 2 optical image acquired within the same area and period. Data fusion is a formal framework in which are expressed means and tools for the alliance of data originating from different sources. It aims at obtaining information of greater quality; the exact definition of “greater quality” will depend upon the application (Ranchin and Wald, 2010).
The principal motivation for image fusion is to improve the quality of the information contained in the output image in a process known as synergy. A study of existing image fusion techniques and applications shows that image fusion can provide us with an output image with an improved quality. In this case, the benefits of image fusion include:
- Extended range of operation.
- Extended spatial and temporal coverage.
- Reduced uncertainty.
- Increased reliability.
- Robust system performance.
- Compact representation of information.
Data preparation
Load libraries, declare variables and data paths.
rm(list=ls(all=TRUE))    #Clears R memory
unlink(".RData")
if (!require("pacman")) install.packages("pacman"); library(pacman) #package manager( loads required packages/libraries in list as below if not installed they will be installed
p_load(raster, terra)

options(warn=1)
cat("Set variables and start processing\n")
## Set variables and start processingRoot <- 'D:/JKUAT/RESEARCH_Projects/Eswatini/Data/'
Path_out <- paste0(Root,"Output/")Load UAV and Sentinel 2 optical images.
path <- list.files(paste0(Root,'S2/interim/'),pattern = (".tif$"), recursive = TRUE, full.names = TRUE)
path
## [1] "D:/JKUAT/RESEARCH_Projects/Eswatini/Data/S2/interim/RT_T36JUR_20210418T073611_B02.tif"
## [2] "D:/JKUAT/RESEARCH_Projects/Eswatini/Data/S2/interim/RT_T36JUR_20210418T073611_B03.tif"
## [3] "D:/JKUAT/RESEARCH_Projects/Eswatini/Data/S2/interim/RT_T36JUR_20210418T073611_B04.tif"
## [4] "D:/JKUAT/RESEARCH_Projects/Eswatini/Data/S2/interim/RT_T36JUR_20210418T073611_B08.tif"s <- rast(path)
s## class : SpatRaster
## dimensions : 10980, 10980, 4 (nrow, ncol, nlyr)
## resolution : 10, 10 (x, y)
## extent : 3e+05, 409800, 6990220, 7100020 (xmin, xmax, ymin, ymax)
## coord. ref. : +proj=utm +zone=36 +south +datum=WGS84 +units=m +no_defs
## sources : RT_T36JUR_20210418T073611_B02.tif
## RT_T36JUR_20210418T073611_B03.tif
## RT_T36JUR_20210418T073611_B04.tif
## ... and 1 more source(s)
## names : RT_T36J~611_B02, RT_T36J~611_B03, RT_T36J~611_B04, RT_T36J~611_B08path <- list.files(paste0(Root,'WingtraOne/'),pattern = (".tif$"), full.names = TRUE)
#reorder the bands to macth those in S2
paths <- path
paths[3] <- path[4]
paths[4] <- path[3]
paths## [1] "D:/JKUAT/RESEARCH_Projects/Eswatini/Data/WingtraOne/mpolonjeni_05042021m3f1_transparent_reflectance_blue.tif"
## [2] "D:/JKUAT/RESEARCH_Projects/Eswatini/Data/WingtraOne/mpolonjeni_05042021m3f1_transparent_reflectance_green.tif"
## [3] "D:/JKUAT/RESEARCH_Projects/Eswatini/Data/WingtraOne/mpolonjeni_05042021m3f1_transparent_reflectance_red.tif"
## [4] "D:/JKUAT/RESEARCH_Projects/Eswatini/Data/WingtraOne/mpolonjeni_05042021m3f1_transparent_reflectance_nir.tif"v <- rast(paths)
v## class : SpatRaster
## dimensions : 12981, 6363, 4 (nrow, ncol, nlyr)
## resolution : 0.12059, 0.12059 (x, y)
## extent : 390445, 391212.3, 7070171, 7071736 (xmin, xmax, ymin, ymax)
## coord. ref. : +proj=utm +zone=36 +south +datum=WGS84 +units=m +no_defs
## sources : mpolonjeni_05042021m3f1_transparent_reflectance_blue.tif
## mpolonjeni_05042021m3f1_transparent_reflectance_green.tif
## mpolonjeni_05042021m3f1_transparent_reflectance_red.tif
## ... and 1 more source(s)
## names : mpolonj~ce_blue, mpolonj~e_green, mpolonj~nce_red, mpolonj~nce_nirNow check image properties and assign meaningful names to its bands.
#Resolution
res(s)
## [1] 10 10#Extents
ext(s)## SpatExtent : 3e+05, 409800, 6990220, 7100020 (xmin, xmax, ymin, ymax)#image dimensions
dim(s)## [1] 10980 10980 4#Number of bands
nlyr(s)## [1] 4names(s) <- c("b", "g","r", "nir")
s## class : SpatRaster
## dimensions : 10980, 10980, 4 (nrow, ncol, nlyr)
## resolution : 10, 10 (x, y)
## extent : 3e+05, 409800, 6990220, 7100020 (xmin, xmax, ymin, ymax)
## coord. ref. : +proj=utm +zone=36 +south +datum=WGS84 +units=m +no_defs
## sources : RT_T36JUR_20210418T073611_B02.tif
## RT_T36JUR_20210418T073611_B03.tif
## RT_T36JUR_20210418T073611_B04.tif
## ... and 1 more source(s)
## names : b, g, r, nirres(v)## [1] 0.12059 0.12059ext(v)## SpatExtent : 390445.0352, 391212.34937, 7070171.12052, 7071736.49931 (xmin, xmax, ymin, ymax)dim(v)## [1] 12981 6363 4names(v) <- c("b", "g","r", "nir")
v## class : SpatRaster
## dimensions : 12981, 6363, 4 (nrow, ncol, nlyr)
## resolution : 0.12059, 0.12059 (x, y)
## extent : 390445, 391212.3, 7070171, 7071736 (xmin, xmax, ymin, ymax)
## coord. ref. : +proj=utm +zone=36 +south +datum=WGS84 +units=m +no_defs
## sources : mpolonjeni_05042021m3f1_transparent_reflectance_blue.tif
## mpolonjeni_05042021m3f1_transparent_reflectance_green.tif
## mpolonjeni_05042021m3f1_transparent_reflectance_red.tif
## ... and 1 more source(s)
## names : b, g, r, nirCrop/clip Sentinel 2 image to UAV image extents.
s <- crop(s, ext(v), snap="near")Display the images side by side.
x11()
par(mfrow = c(1, 2)) #c(bottom, left, top, right)
plotRGB(s, r="nir", g="r", b="g", stretch="lin", axes=T, mar = c(4, 5, 1.4, 0.2), main="S2", cex.axis=0.5)
box()
plotRGB(v, r="nir", g="r", b="g", stretch="lin", axes=T, mar = c(4, 5, 1.4, 0.2), main="UAV", cex.axis=0.5)
box()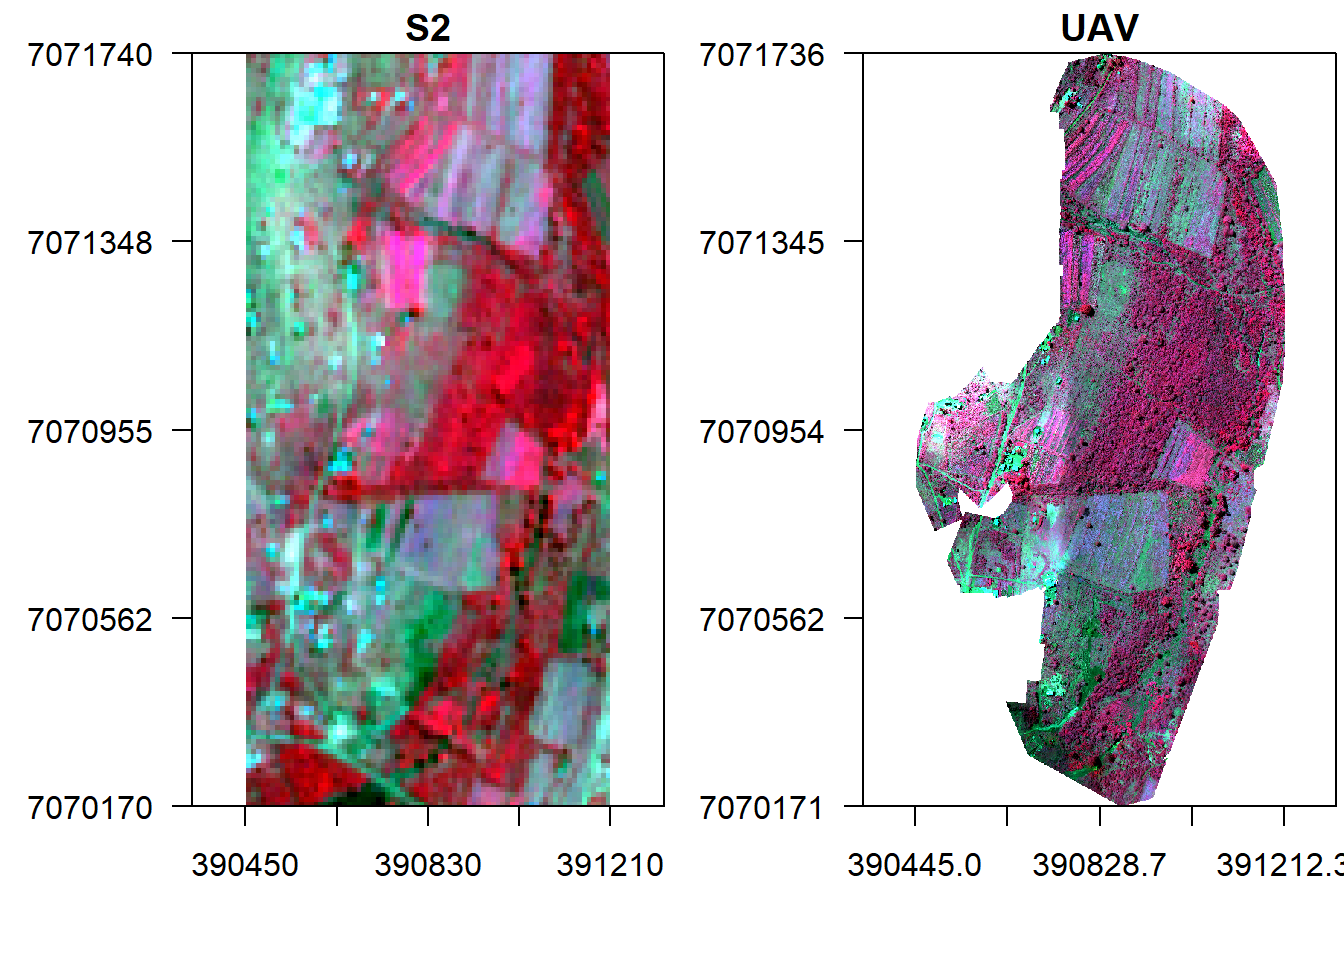
First let us conduct a spectral fusion of S2 and UAV images. To do this we have to resample UAV image to S2 extents and another to one to 1 m.
v_r <- resample(v, s, method='bilinear')
ext(v_r) == ext(s)
## [1] TRUEtemp <-rast(nrow=1570,ncol=760,ext(s)) #empty object to upscale UAV to 1 m resolution
res(temp) ## [1] 1 1v1 <- resample(v, temp, method='bilinear')
res(v1) ## [1] 1 1Pixel fusion
This sections considers fusion techniques which rely on simple pixel based operations on input image values. The assumption is that the input images are spatially and temporally aligned, semantically equivalent and radiometrically calibrated. Therefore, let us fuse the two images by multiplication and display it against the original ones.
#Fuse by multiplication
f1 <- s * v_r
f1
## class : SpatRaster
## dimensions : 157, 76, 4 (nrow, ncol, nlyr)
## resolution : 10, 10 (x, y)
## extent : 390450, 391210, 7070170, 7071740 (xmin, xmax, ymin, ymax)
## coord. ref. : +proj=utm +zone=36 +south +datum=WGS84 +units=m +no_defs
## source : memory
## names : b, g, r, nir
## min values : 0.0002068561, 0.0005442272, 0.0003042399, 0.0094109712
## max values : 0.01279990, 0.01698387, 0.02435488, 0.18333833#Display fused image alongside original UAV
x11()
par(mfrow = c(1, 3),mar = c(4, 5, 1.4, 0.2))
plotRGB(v, r="nir", g="r", b="g", stretch="lin", axes=T, mar = c(4, 5, 1.4, 0.2), main="UAV", cex.axis=0.7)
box()
plotRGB(s, r="nir", g="r", b="g", stretch="lin", axes=T, mar = c(4, 5, 1.4, 0.2), main="S2", cex.axis=0.7)
box()
plotRGB(f1, r="nir", g="r", b="g", stretch="lin", axes=T, mar = c(4, 5, 1.4, 0.2), main="Fused_multi", cex.axis=0.7)
box()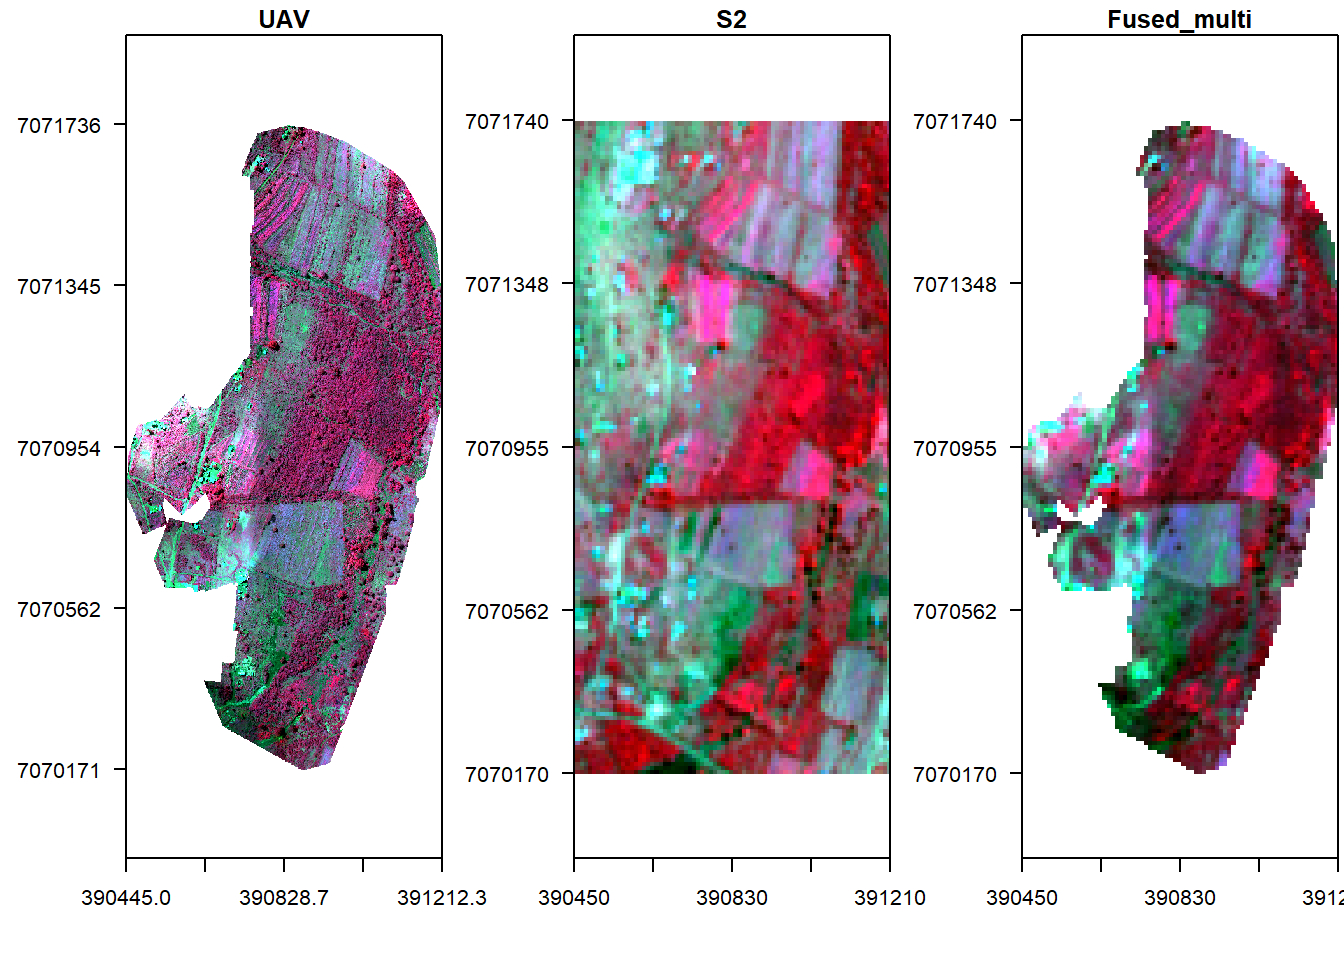
What about mean fusion (i.e. taking the mean of each pixel’s reflectance in both UAV and S2)?
#Fuse by multiplication
f2 <- mean(s, v_r)
f2
## class : SpatRaster
## dimensions : 157, 76, 4 (nrow, ncol, nlyr)
## resolution : 10, 10 (x, y)
## extent : 390450, 391210, 7070170, 7071740 (xmin, xmax, ymin, ymax)
## coord. ref. : +proj=utm +zone=36 +south +datum=WGS84 +units=m +no_defs
## source : memory
## names : b, g, r, nir
## min values : 0.01532078, 0.02351120, 0.01861056, 0.09712517
## max values : 0.1225800, 0.1548688, 0.1717744, 0.4470450#Display fused image alongside original UAV
x11()
par(mfrow = c(2, 2), mar = c(4, 5, 1.4, 0.2))
plotRGB(v, r="nir", g="r", b="g", stretch="lin", main="UAV", axes=T, mar = c(4, 5, 1.4, 0.2))
box()
plotRGB(s, r="nir", g="r", b="g", stretch="lin", main="S2", axes=T, mar = c(4, 5, 1.4, 0.2))
box()
plotRGB(f1, r="nir", g="r", b="g", stretch="lin", main="Fused_mult", axes=T, mar = c(4, 5, 1.4, 0.2))
box()
plotRGB(f2, r="nir", g="r", b="g", stretch="lin", main="Fused_mean", axes=T, mar = c(4, 5, 1.4, 0.2))
box()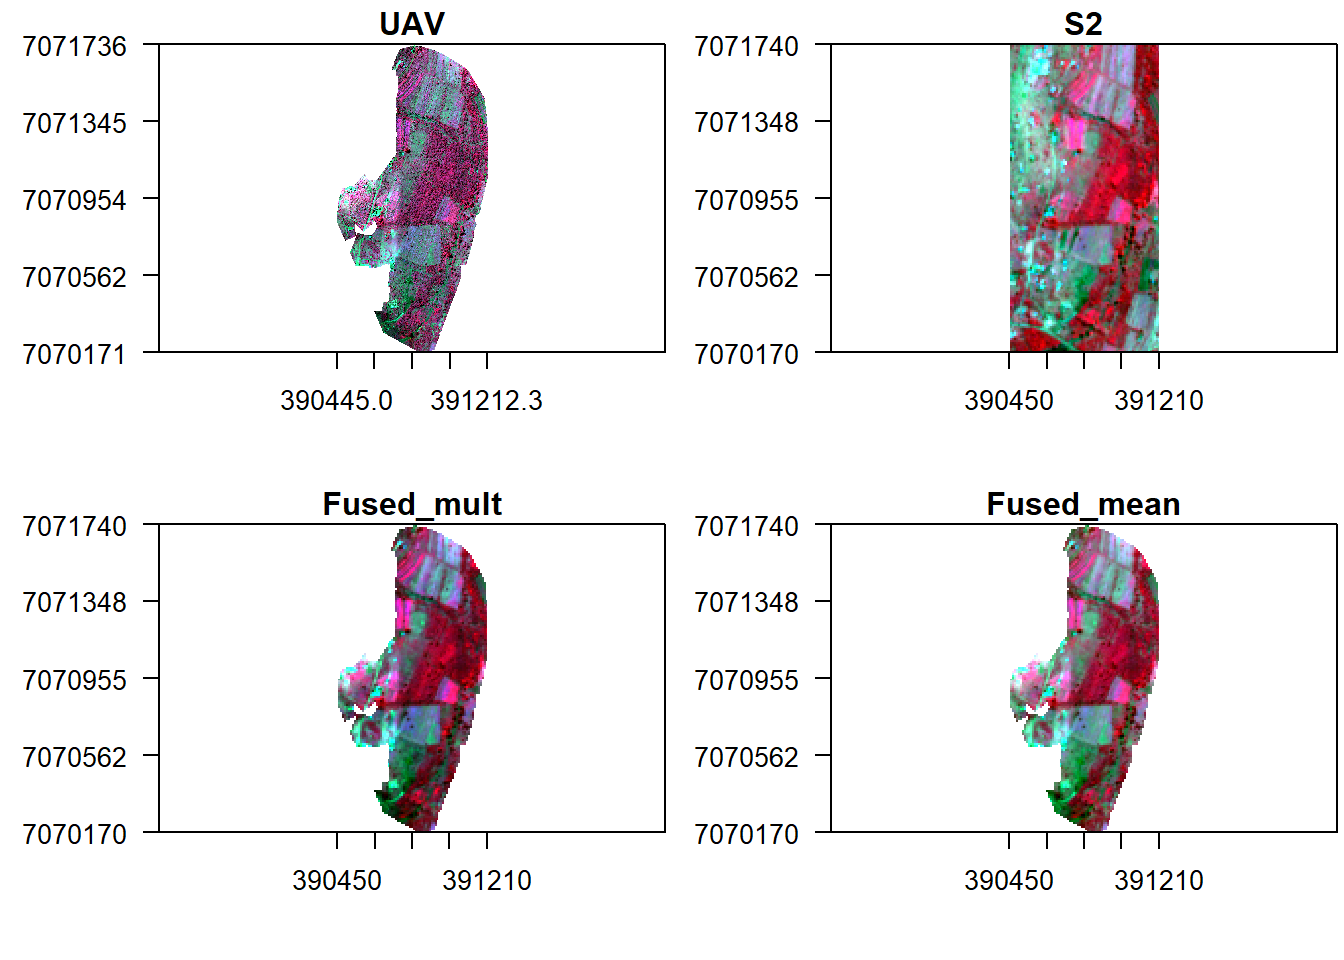
Let us finally follow the fusion approach in Zou et al (2018).
f3 = (s/v_r)*v_r
x11()
par(mfrow = c(2, 3), mar = c(4, 5, 1.4, 0.2))
plotRGB(v, r="nir", g="r", b="g", stretch="lin",  main="UAV", axes=T, mar = c(4, 5, 1.4, 0.2))
box()
plotRGB(s, r="nir", g="r", b="g", stretch="lin", main="S2", axes=T, mar = c(4, 5, 1.4, 0.2))
box()
plotRGB(f1, r="nir", g="r", b="g", stretch="lin", main="Fused_mult", axes=T, mar = c(4, 5, 1.4, 0.2))
box()
plotRGB(f2, r="nir", g="r", b="g", stretch="lin", main="Fused_mean", axes=T, mar = c(4, 5, 1.4, 0.2))
box()
plotRGB(f3, r="nir", g="r", b="g", stretch="lin", main="Zhou etal", axes=T, mar = c(4, 5, 1.4, 0.2))
box()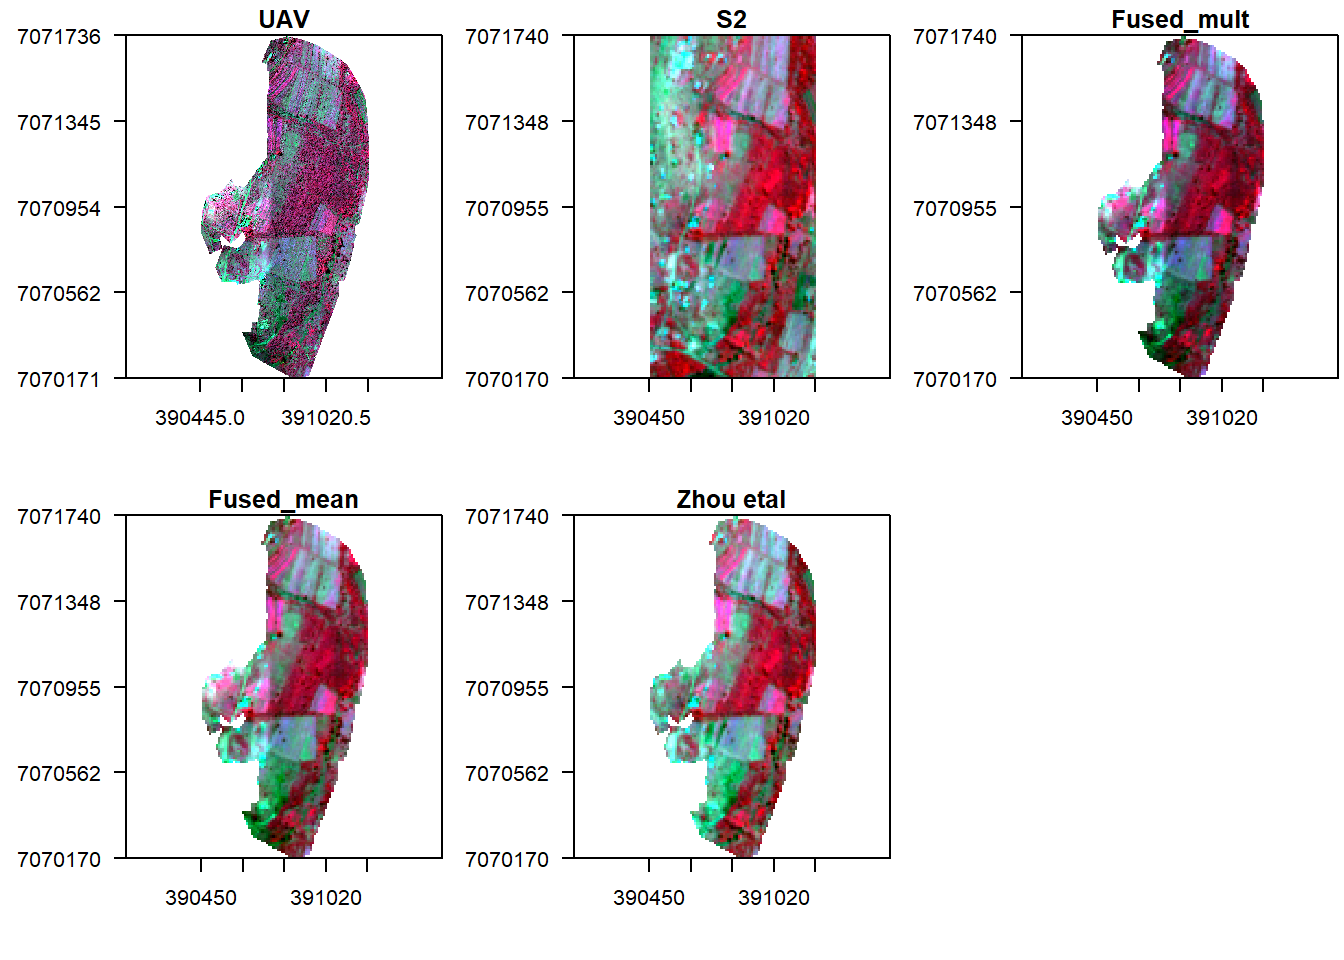
There seem to be some linear relationship between UAV and Sentinel 2 surface reflectance. However it is evident that reflectance values from UAV are higher compared to those in Sentinel 2. So what now?
Feature based fusion
In feature fusion we fuse together the features \(F_k,k \in{1,2, \dots, K}\). These features can be vegetation indices like Normalized Difference Index (NDVI) or feature maps that have been made semantically equivalent by transforming them into probabilistic \(p(m,n)\), or likelihood, maps.
Let us start with NDVI (\(\text{NDVI}=\frac{\text{NIR}-\text{Red}}{\text{NIR}+\text{Red}}\). First compute NDVI for both UAV and S2.
n_v <- (subset(v_r,"nir")-subset(v_r,"r"))/(subset(v_r,"nir")+subset(v_r,"r"))
n_s <- (subset(s,"nir")-subset(s,"r"))/(subset(s,"nir")+subset(s,"r"))
How can we fuse the NDVI index? Let us take an average of the two.
nf <- mean(n_v, n_s)
x11()
par(mfrow = c(2, 2), mar = c(5, 5, 1.4, 0.2))#c(bottom, left, top, right)
plot(n_v, main="UAV NDVI")
plot(n_s, main="S2 NDVI")
plot(nf, main="Fused NDVI")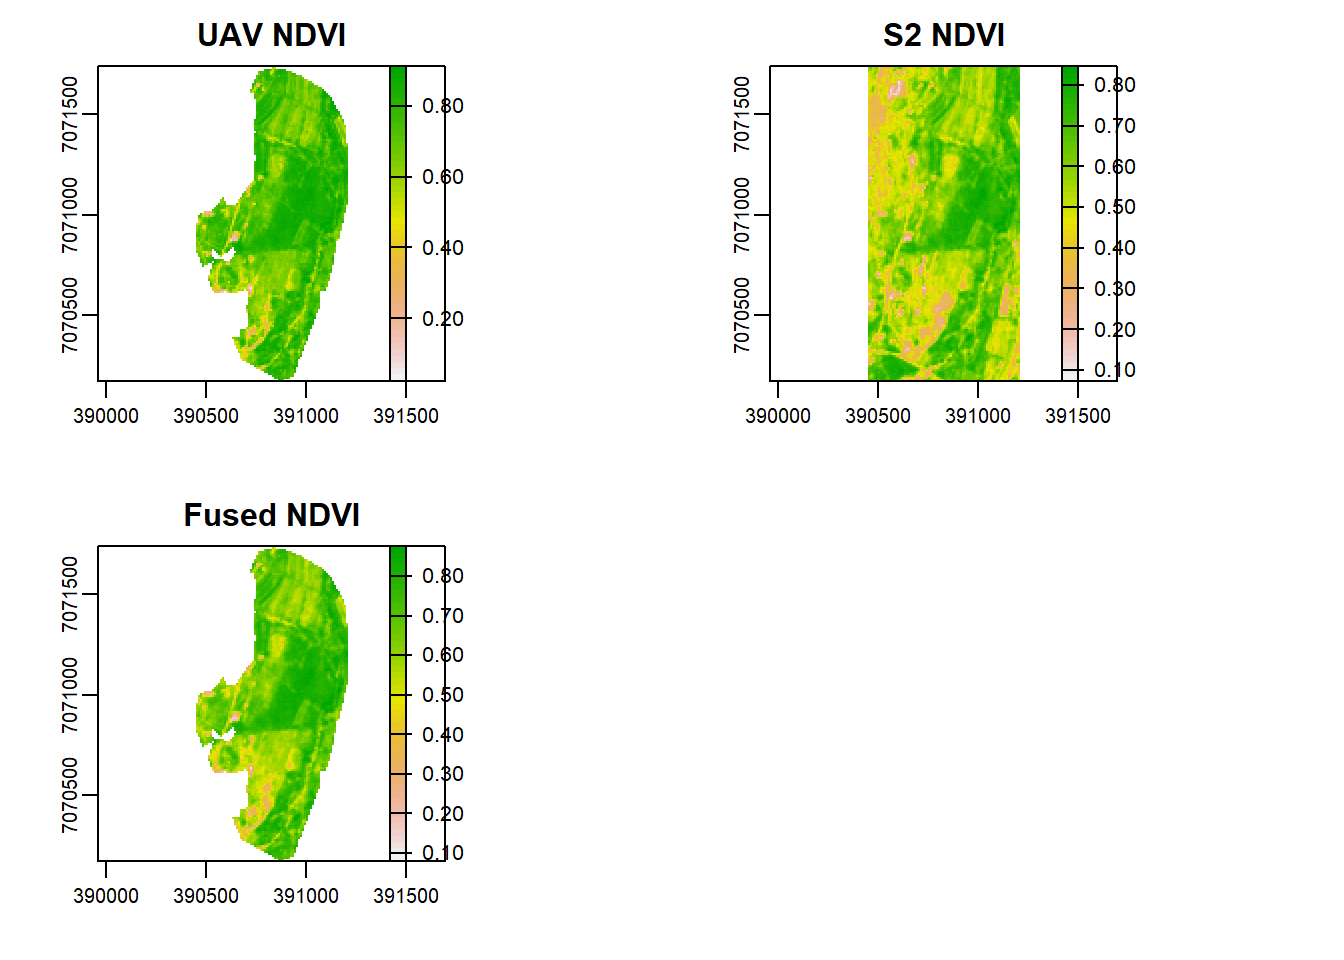
Is there any difference between S2, UAV, and the fused NDVI images as shown above?
Spatial-spectral fusion
Previously we upsampled the UAV image in order to conduct fusion. While this reduces spectral variability it destroys spatial resolution. Therefore, in this section we will first donwsample the Satellite image to match UAV spatial resolution and then proceed to conduct image fusion. This way, we will improve both spatial and spectral information of Sentinel 2 image and spectral information for UAV.
Modelling reflectance
- Can we improve the resolution of S2 using UAV?
- Can we predict UAV reflectance in places not imaged by the drones?
Let’s check the relationship between the two.
x11()
par(mfrow = c(2, 2), mar = c(4, 5, 1.4, 0.2))
plot(as.vector(subset(s,'b')),as.vector(subset(v_r,'b')), xlab='S2', ylab='W1 UAV', main="Blue band",pch=16,cex=0.75, col='blue')
plot(as.vector(subset(s,'g')),as.vector(subset(v_r,'g')), xlab='S2', ylab='W1 UAV', main="Green band",pch=16,cex=0.75, col='green')
plot(as.vector(subset(s,'r')),as.vector(subset(v_r,'r')), xlab='S2', ylab='W1 UAV', main="Red band",pch=16,cex=0.75, col='red')
plot(as.vector(subset(s,'nir')),as.vector(subset(v_r,'nir')), xlab='S2', ylab='W1 UAV', main="NIR band",pch=16,cex=0.75)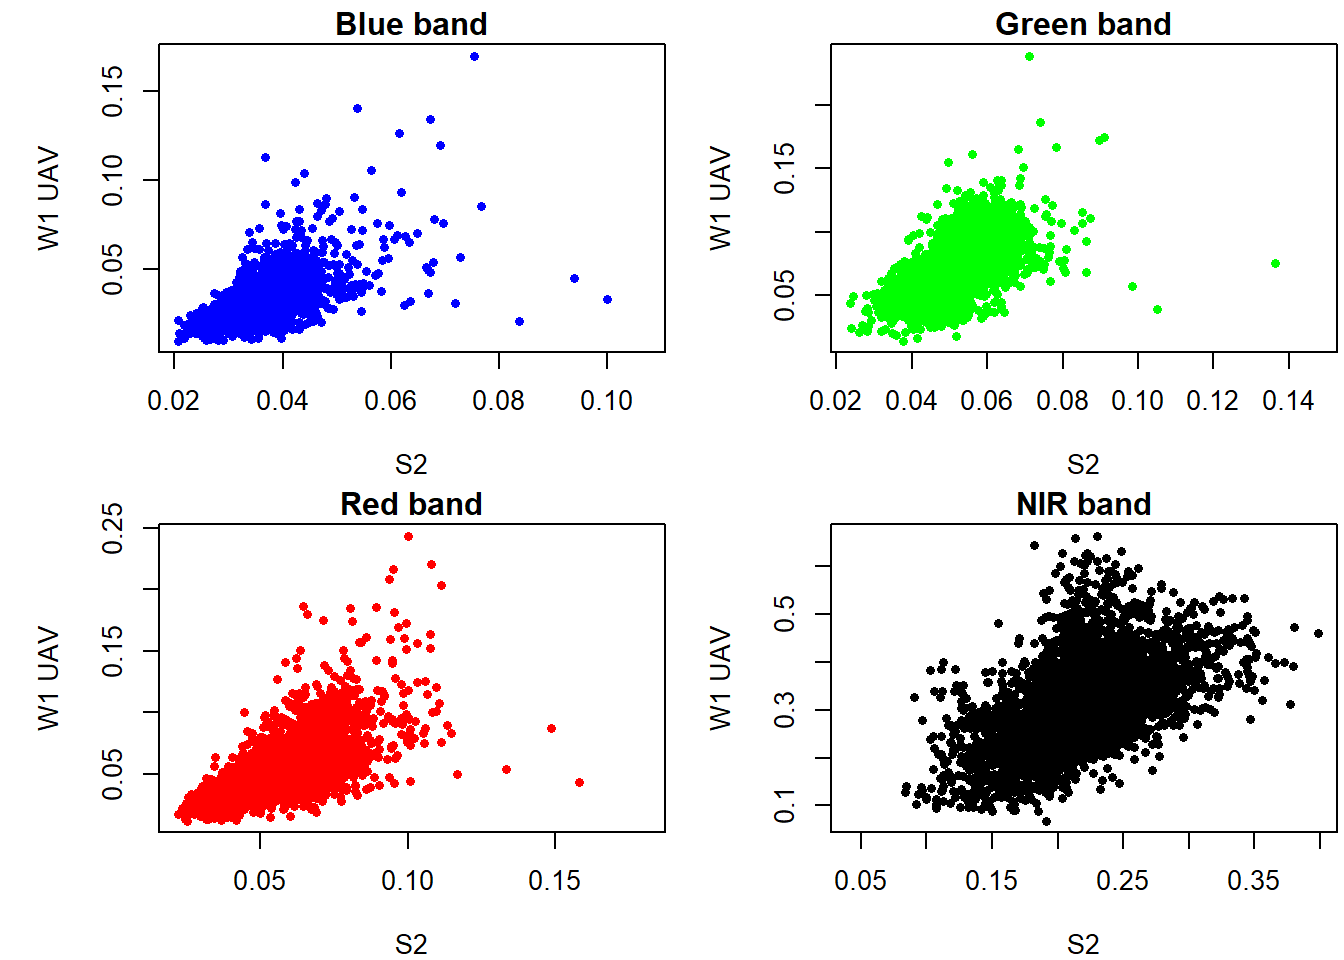
Lets create sample points from S2 (10 m resolution) and upscaled UAV (10 m resolution) and use them to create a model that we can predict S2 reflectance based on UAV 1 m resolution. Essentially what we are doing here is to create a model that can predict S2 reflectance at a resolution of 1 m.
set.seed(530)
x11()
points <- spatSample(v_r, 900, "random", as.points=T, na.rm=T, values=F)
plotRGB(v_r, r="nir", g="r", b="g", stretch="lin",  main="UAV+sampling points", axes=T, mar = c(4, 5, 1.4, 0.2))
plot(points,add=T)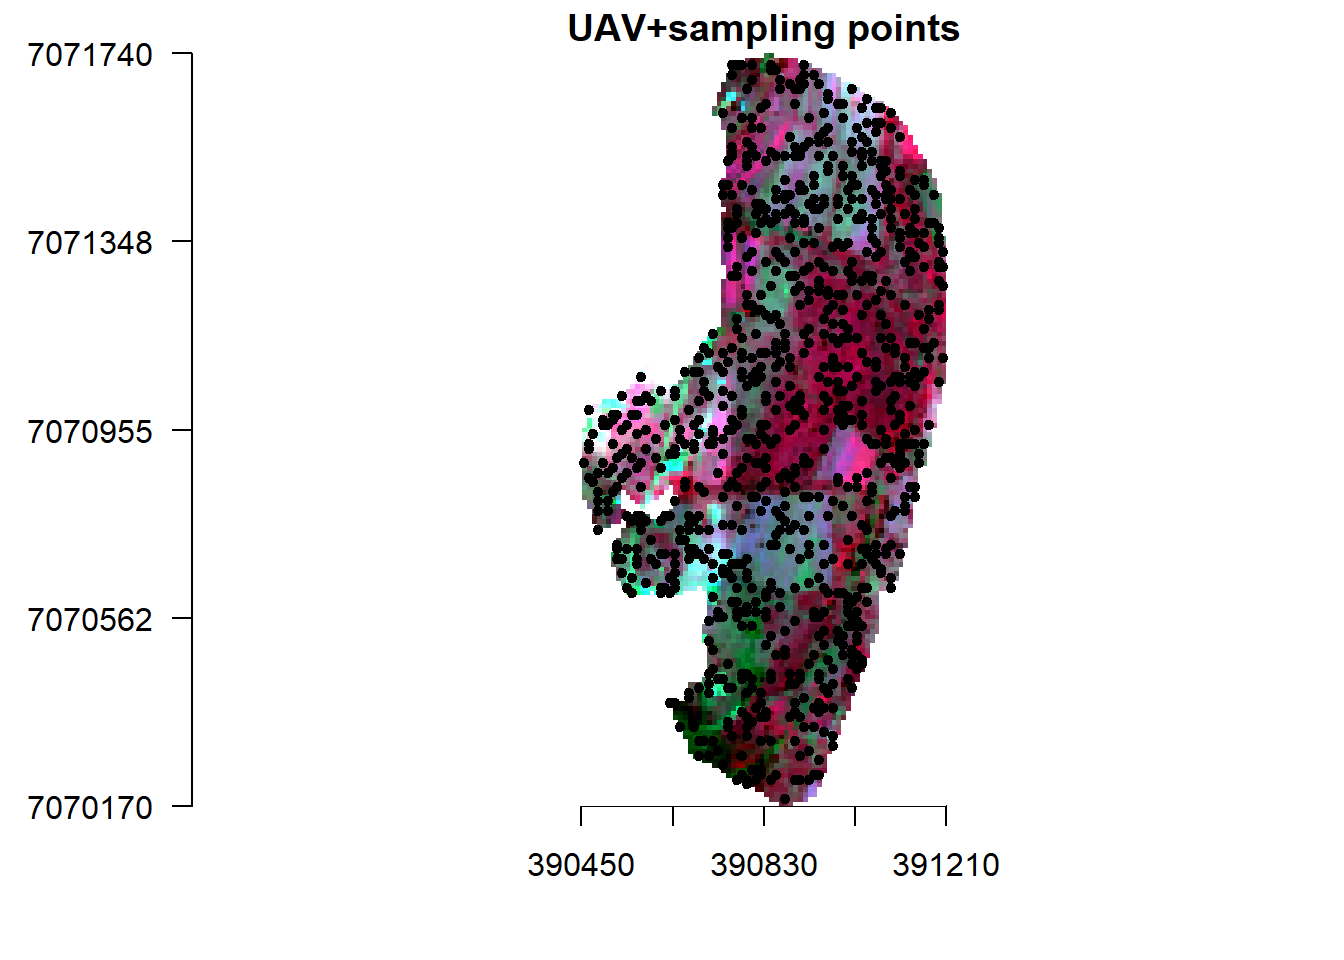
Now extract reflectance values from the two images.
s2_p <- extract(s, points, drop=F)
head(s2_p)
## ID b g r nir
## 1 1 0.03010000 0.04340000 0.04370000 0.2039
## 2 2 0.02669999 0.04040000 0.03190000 0.2555
## 3 3 0.02600000 0.03800000 0.02760000 0.2727
## 4 4 0.02719999 0.03929999 0.03590000 0.1978
## 5 5 0.04079999 0.06200000 0.06999999 0.2210
## 6 6 0.04020000 0.05670000 0.06260000 0.2209vr_p <- extract(v_r, points, drop=F)
head(vr_p)## ID b g r nir
## 1 1 0.02557389 0.05894550 0.03758506 0.3497387
## 2 2 0.01882389 0.05033908 0.02247731 0.3220550
## 3 3 0.01982662 0.05362828 0.02300457 0.3844531
## 4 4 0.02047731 0.05194858 0.02767093 0.3193594
## 5 5 0.04172961 0.09754695 0.07302261 0.4105712
## 6 6 0.03550068 0.07566584 0.05827252 0.2950630Create a model.
data <- data.frame(S2=s2_p[,-1], UAV=vr_p[,-1])
head(data)
## S2.b S2.g S2.r S2.nir UAV.b UAV.g UAV.r
## 1 0.03010000 0.04340000 0.04370000 0.2039 0.02557389 0.05894550 0.03758506
## 2 0.02669999 0.04040000 0.03190000 0.2555 0.01882389 0.05033908 0.02247731
## 3 0.02600000 0.03800000 0.02760000 0.2727 0.01982662 0.05362828 0.02300457
## 4 0.02719999 0.03929999 0.03590000 0.1978 0.02047731 0.05194858 0.02767093
## 5 0.04079999 0.06200000 0.06999999 0.2210 0.04172961 0.09754695 0.07302261
## 6 0.04020000 0.05670000 0.06260000 0.2209 0.03550068 0.07566584 0.05827252
## UAV.nir
## 1 0.3497387
## 2 0.3220550
## 3 0.3844531
## 4 0.3193594
## 5 0.4105712
## 6 0.2950630# Plot the data
plot(S2.b~UAV.b, data=data, pch=16)
# Create a linear regression model
l.model <- lm(S2.b~UAV.b, data=data)
# Add the fitted line
abline(l.model, col="red")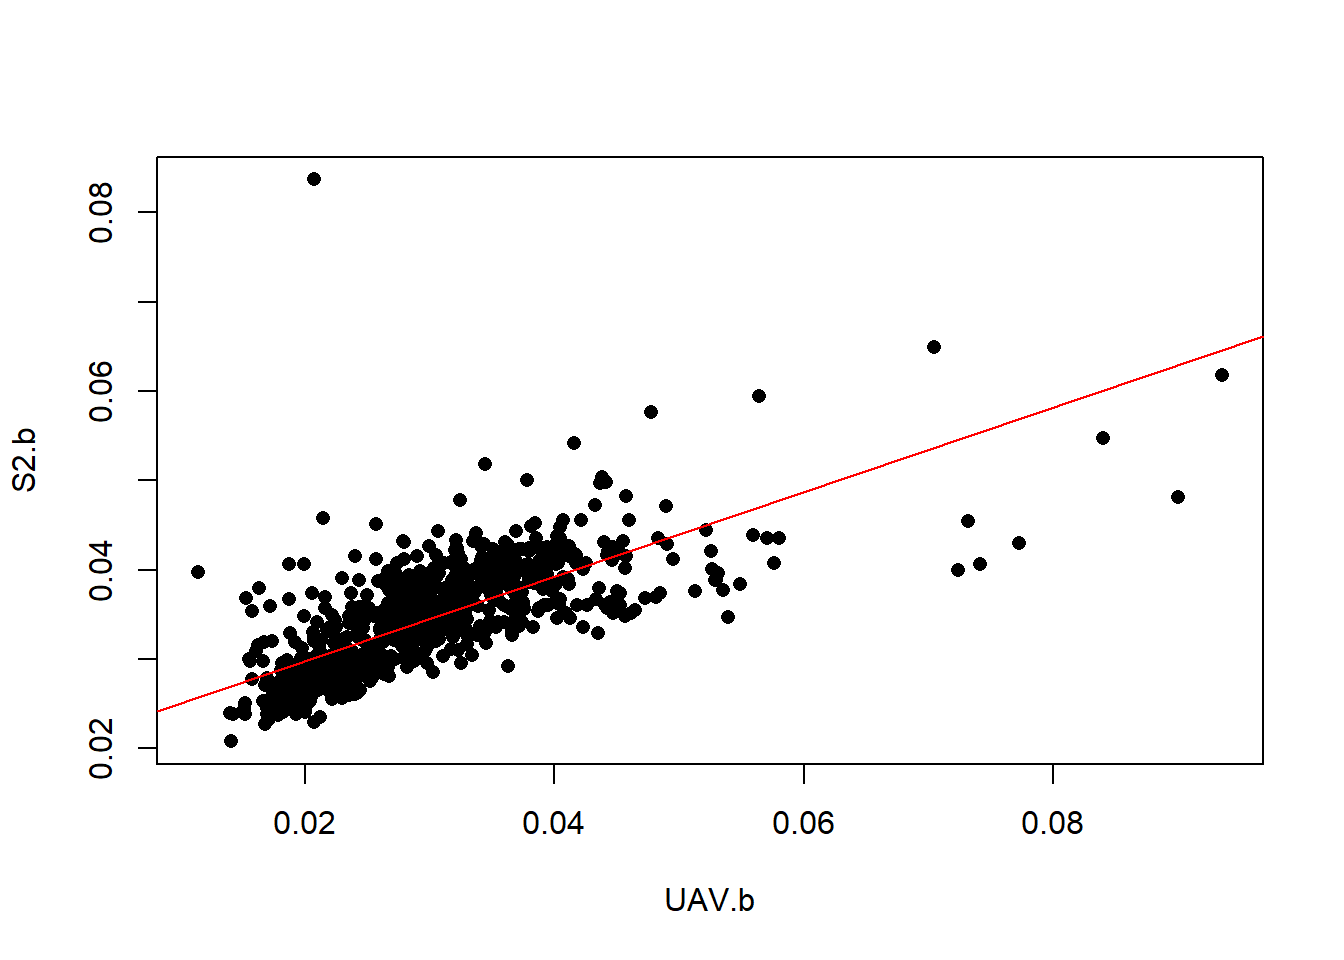
Looks like the relation within the blue band is not linear. Let’s try a non-linear SVM model.
#SVM
library(e1071)
svm.model <- svm(S2.b~UAV.b, data=data)
svm.pred <- predict(svm.model, data)
#SVM
library(randomForest)
rfmod <- randomForest(S2.b~UAV.b, data=data)
rf.pred <- predict(rfmod, data)
x11()
plot(S2.b~UAV.b,data, pch=16)
points(data$S2.b, svm.pred, col = "blue", pch=4)
points(data$S2.b, rf.pred, col = "red", pch=4)
legend("topright",c("Data","SVM","RF"), pch= c(16, 4, 4),col=c("black", "blue","red"))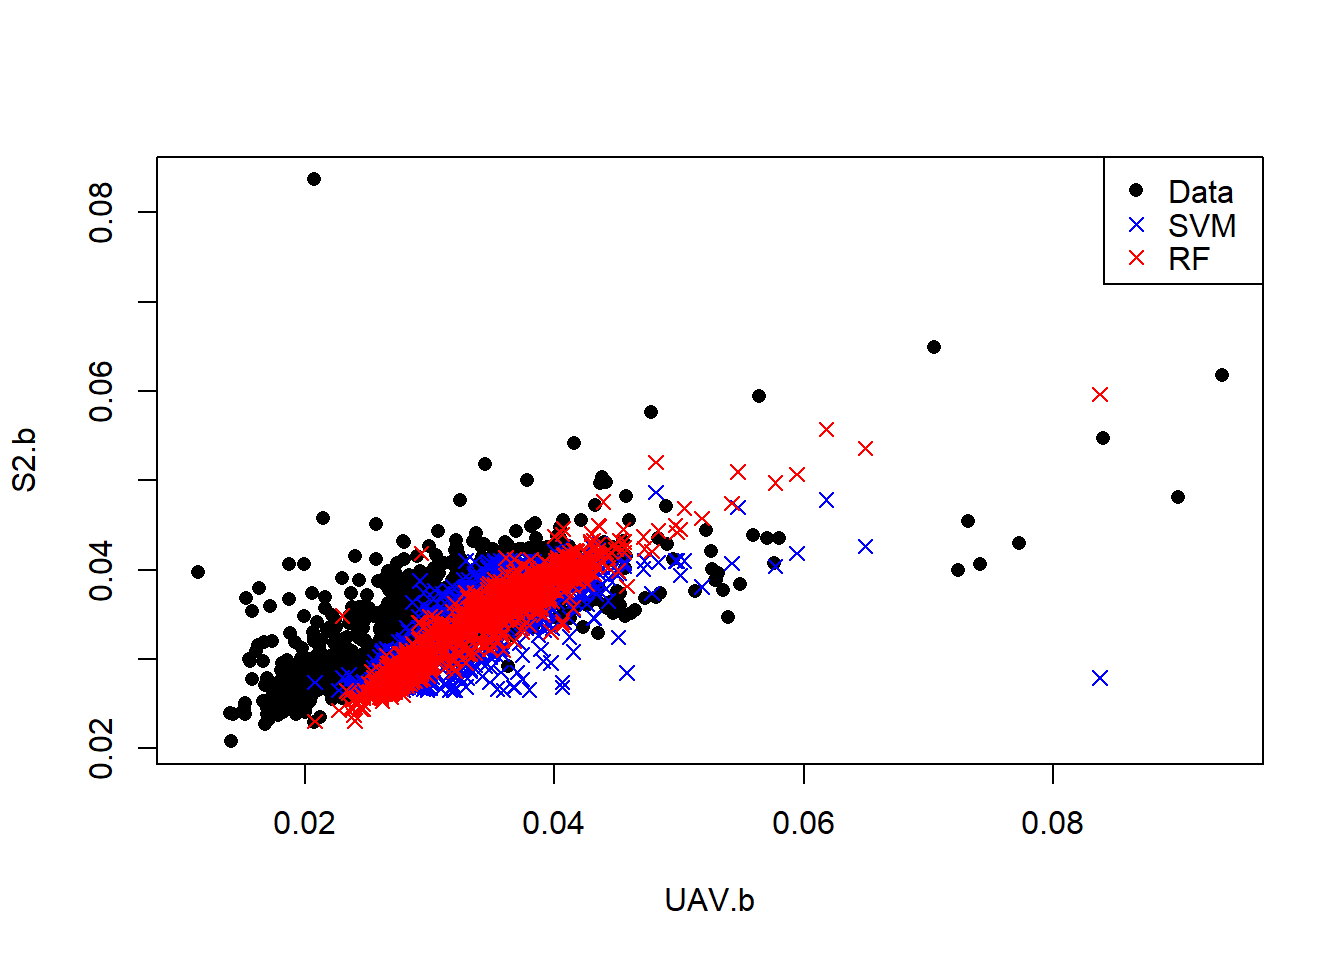
Predicting Sentinel 2 reflectance
SVM and RF models have better characterized the relationship between S2 and UAV blue bands. Let predict high resolution S2 band from existing UAV.
UAV <- v1[['b']]
names(UAV) <-'UAV.b'
s2h.b <- predict(UAV, rfmod, na.rm=T)

s2h.svm <- predict(UAV, svm.model, na.rm=T)

x11()
par(mfrow = c(1, 2), mar = c(4, 5, 1.4, 0.2))
plot(s2h.svm,  main="svm S2 1m Blue band")
plot(s2h.b, main="RF S2 1m Blue band")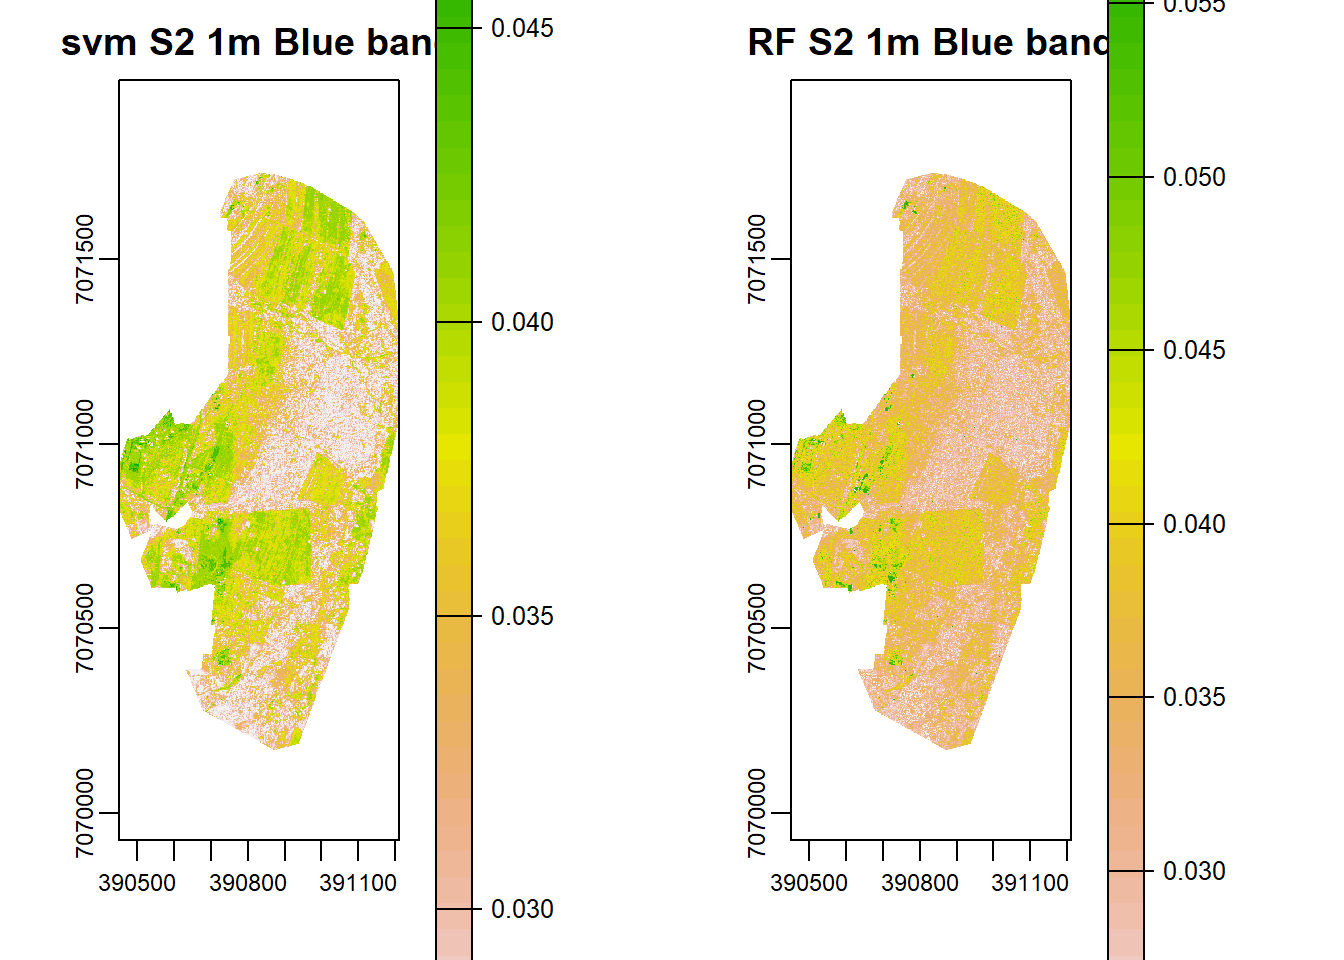
# #parallel processing in raster
# UAv <- raster(UAV)
# library(snow)
# startTime <- Sys.time()
# cat("Start time", format(startTime),"\n")
# beginCluster()
#  r4 <- predict(UAV, rfmod,na.rm=T)
# endCluster()
# timeDiff <- Sys.time() - startTime
# cat("\n Processing time", format(timeDiff), "\n")
Validation
But how do we know if this predictions are accurate? We can plot predicted vs actual and also compute RMSE and Mean Absolute Percentage Error (MAPE) using training data. MAPE is given as:
MAPE <- function (y_pred, y_true){
    MAPE <- mean(abs((y_true - y_pred)/y_true))
    return(MAPE*100)
}
and RMSE,
rmse <- function(error){
  sqrt(mean(error^2))
}
So lets compute MAPE and RMSE for both methods.
svm.rmse <- rmse(svm.pred-data$S2.b)
svm.rmse
## [1] 0.003996155rf.rmse <- rmse(rf.pred-data$S2.b)
rf.rmse## [1] 0.002186289svm.mape <- MAPE(svm.pred, data$S2.b)
svm.mape## [1] 7.315199rf.mape <- MAPE(rf.pred, data$S2.b)
rf.mape## [1] 4.358044From the validations Random Forest gives better prediction than Support Vector machines because it has low MAPE and RMSE error. In that case we can adopt the high resolution S2 image predicted/simulated by RF and fuse it with UAV image at 1 m resolution. Note that we only predict the blue band, we can model and predict the other bands and then fuse them.
#Green band
rfmod <- randomForest(S2.g~UAV.g, data=data)
UAV=subset(v1,'g')
names(UAV) <-'UAV.g'
s2h.g <- predict(UAV, rfmod, na.rm=T)
#red band
rfmod <- randomForest(S2.r~UAV.r, data=data)
UAV=subset(v1,'r')
names(UAV) <-'UAV.r'
s2h.r <- predict(UAV, rfmod, na.rm=T)
#NIR band
rfmod <- randomForest(S2.nir~UAV.nir, data=data)
UAV=subset(v1,'nir')
names(UAV) <-'UAV.nir'
s2h.nir <- predict(UAV, rfmod, na.rm=T)
#Stack them
s2h <- stack(x=c(s2h.b,s2h.g,s2h.r,s2h.nir))
names(s2h) <- c("b", "g","r", "nir")
s2h## class : RasterStack
## dimensions : 1570, 760, 1193200, 4 (nrow, ncol, ncell, nlayers)
## resolution : 1, 1 (x, y)
## extent : 390450, 391210, 7070170, 7071740 (xmin, xmax, ymin, ymax)
## crs : NA
## names : b, g, r, nir
## min values : 0.02305458, 0.03414621, 0.02679058, 0.12475280
## max values : 0.06060897, 0.08070807, 0.10184987, 0.30137640However, the predicted reflectance ranges in all bands except NIR are very low. Why could this be so? Now lets create a high resolution fused image using Zhou’s approach.
Fusion
s2h.fused <- (rast(s2h)/v1)*v1
s2h.fused## class : SpatRaster
## dimensions : 1570, 760, 4 (nrow, ncol, nlyr)
## resolution : 1, 1 (x, y)
## extent : 390450, 391210, 7070170, 7071740 (xmin, xmax, ymin, ymax)
## coord. ref. :
## source : memory
## names : b, g, r, nir
## min values : 0.02305458, 0.03414621, 0.02679058, 0.12475280
## max values : 0.06060897, 0.08070807, 0.10184987, 0.30137640x11()
par(mfrow = c(1, 2), mar = c(4, 5, 1.4, 0.2))
plotRGB(s2h.fused, r="nir", g="r", b="g", stretch="lin", main="UAV+S2 high res", axes=T, mar = c(4, 5, 1.4, 0.2))
box()
plotRGB(v, r="nir", g="r", b="g", stretch="lin", main="UAV", axes=T, mar = c(4, 5, 1.4, 0.2))
box()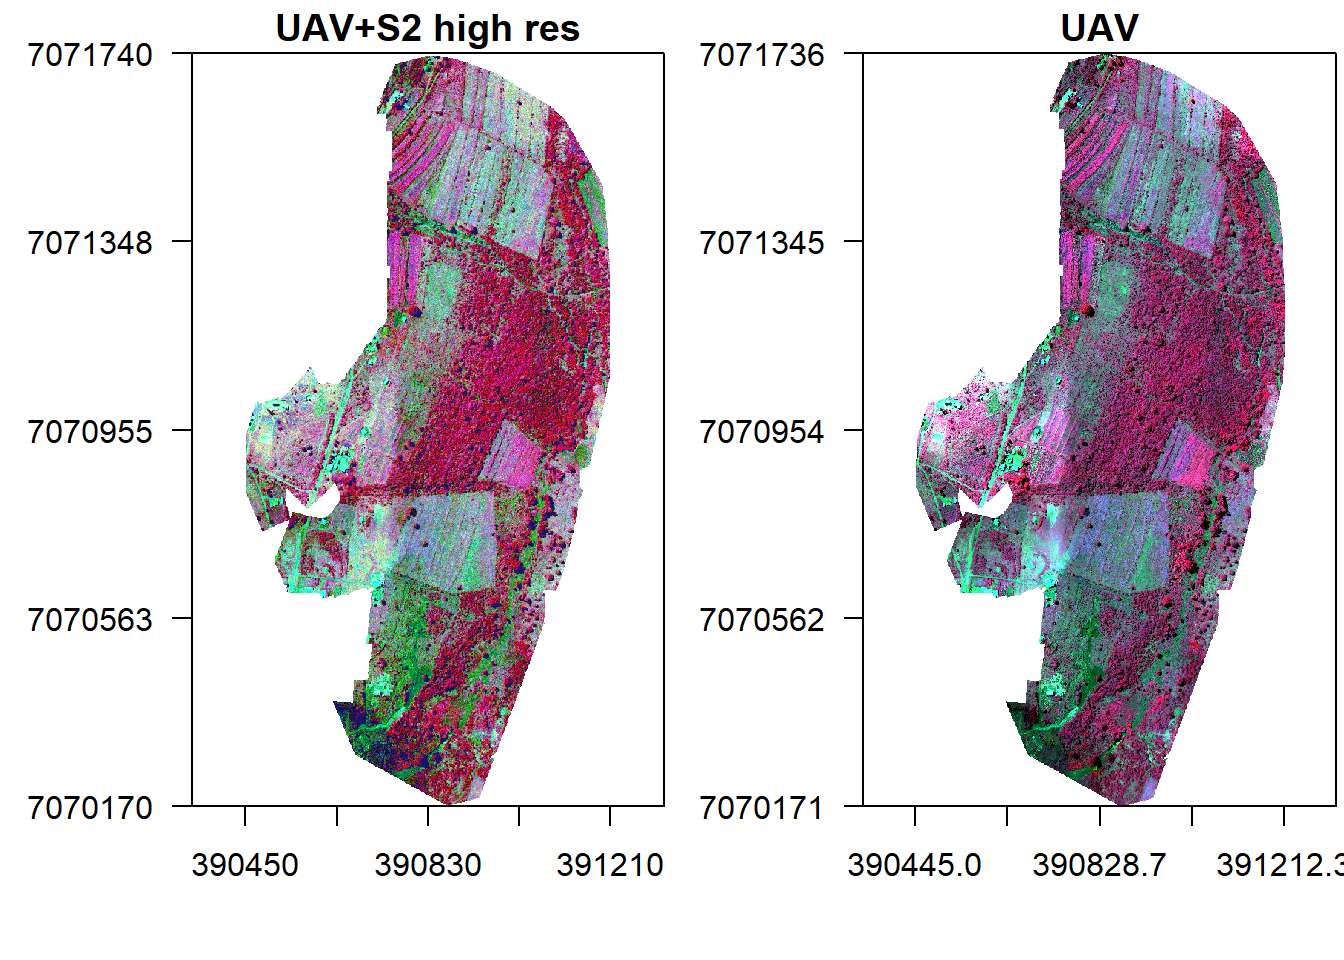
The other option would be use S2 to predict UAV in areas not covered by the drone and then fuse it with S2. However this approach would require consideration of similar land-cover. For instance, we can not train the model in an area with different land-cover say cropland and predict in another area with say Forest. Food for thought.
But let’s step back a little, could sampling from land-cover categories have improved prediction of high resolution S2 done previously with RF? To test this, let us perform a K-means classification and sample from its land-cover map.
image <- v_r
image[is.na(image)] <- 0
nclass <- 4
system.time(
E <- kmeans(as.data.frame(image, na.rm=F), nclass, iter.max = 100, nstart = 9)
)## user system elapsed
## 0.07 0.00 0.08k.map <- image[[1]]
values(k.map) <- E$cluster
k.map[is.na(v_r[[1]])] <- NA
plot(k.map)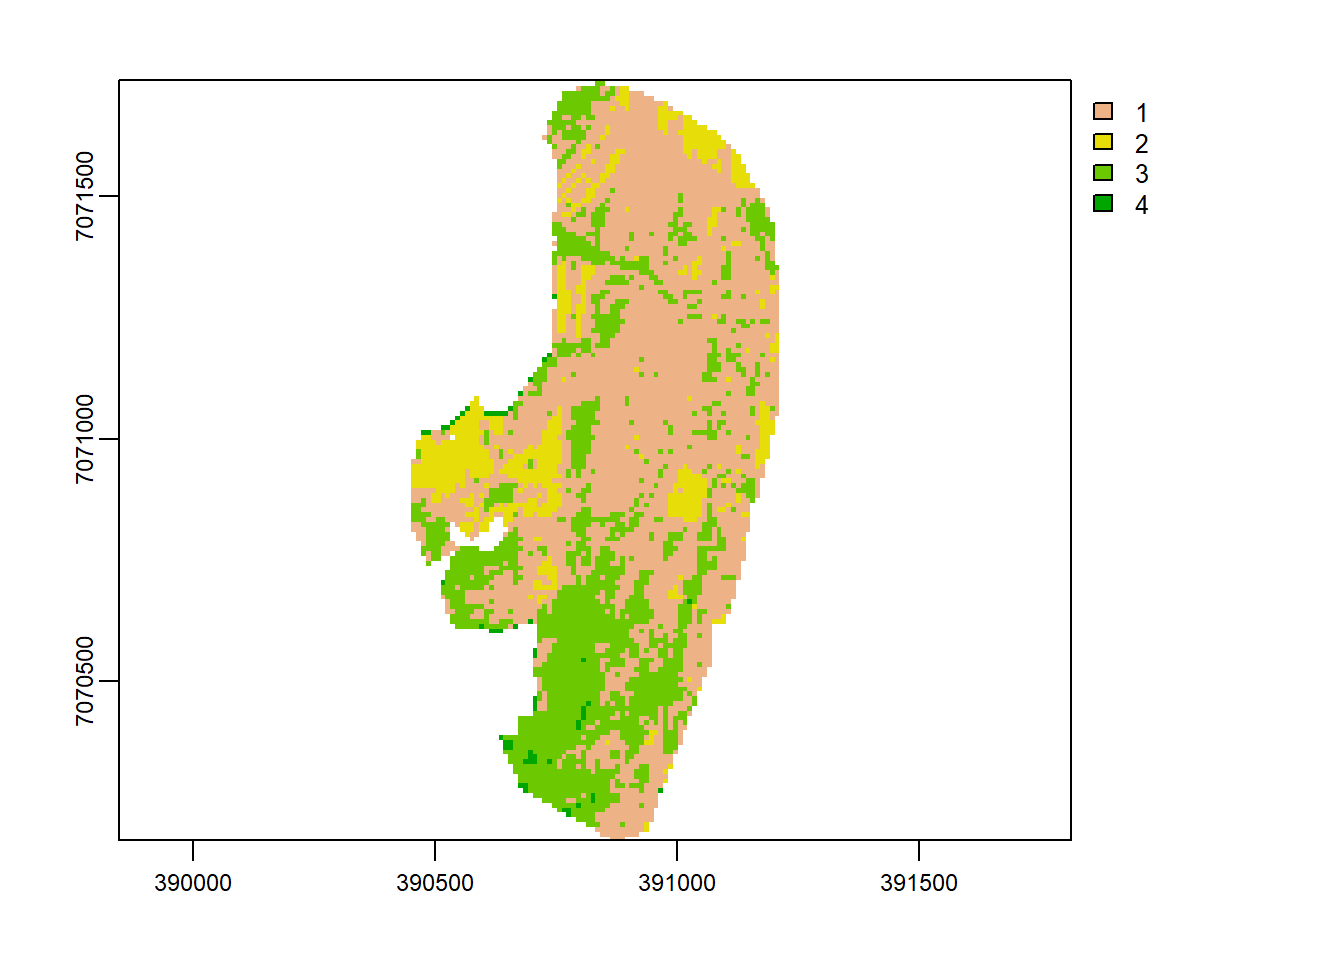
Sample points using stratified random sampling based on the K-means land-cover map.
set.seed(530)
points <- spatSample(k.map, 900, "stratified", as.points=T, na.rm=T, values=F)
x11()
plot(k.map, main="K-means +sampling points", axes=T, mar = c(4, 5, 1.4, 0.2), col=topo.colors(max(values(k.map),na.rm=T)))
plot(points,add=T)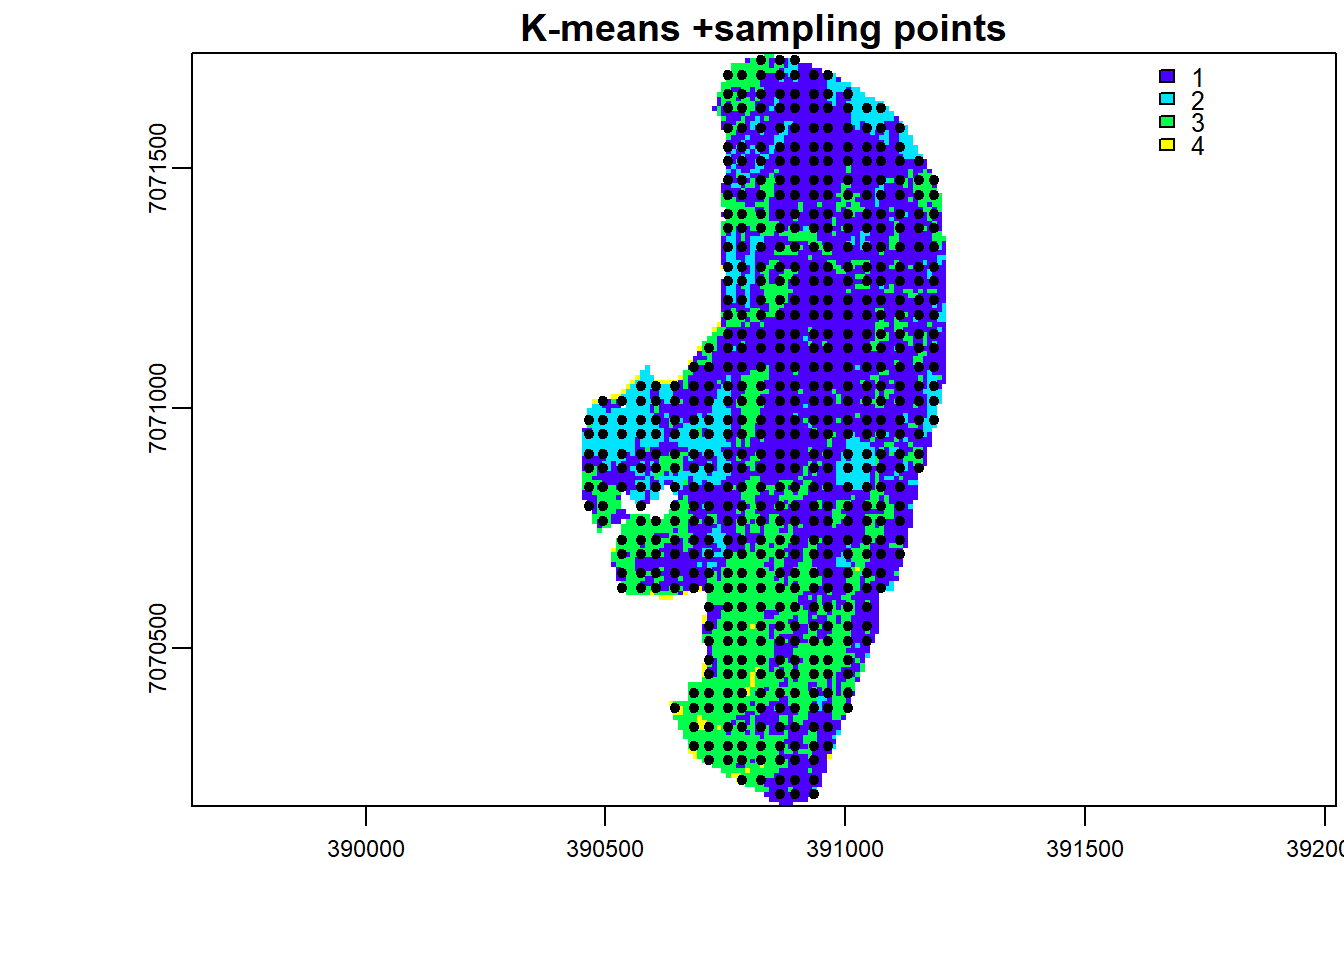
Use the stratified randomly sample points to train and predict simulated high resolution S2.
s2_p <- extract(s, points, drop=F)
head(s2_p)## ID b g r nir
## 1 1 0.04770000 0.05939999 0.07750000 0.1492
## 2 2 0.03960000 0.05549999 0.07099999 0.2073
## 3 3 0.03320000 0.04880000 0.05010000 0.2258
## 4 4 0.03379999 0.04790000 0.06040000 0.1966
## 5 5 0.04420000 0.06200000 0.07959999 0.2172
## 6 6 0.04070000 0.05980000 0.06649999 0.2101vr_p <- extract(v_r, points, drop=F)
head(vr_p)## ID b g r nir
## 1 1 0.05413008 0.09205989 0.11132049 0.2734993
## 2 2 0.04446261 0.10010008 0.08397383 0.4695161
## 3 3 0.03073439 0.07668109 0.05490024 0.4001549
## 4 4 0.02435945 0.06213900 0.04357978 0.3155672
## 5 5 0.03281799 0.06734130 0.06080524 0.2811245
## 6 6 0.03464006 0.07732372 0.05422943 0.3122228data <- data.frame(S2=s2_p[,-1], UAV=vr_p[,-1])
rfmod <- randomForest(S2.b~UAV.b, data=data)
rf.pred <- predict(rfmod, data)Lets evaluate if stratified random sampling improved RF accuracy.
rf.rmse <- rmse(rf.pred-data$S2.b)
rf.rmse
## [1] 0.00193131rf.mape <- MAPE(rf.pred, data$S2.b)
rf.mape## [1] 4.36695We can see that RMSE has by a small margin compared to the case of random sampling. MAPE more or less remained constant. Thus there is a chance that sampling over different land-cover improves prediction.
As an assignment now predict S2 high resolution using a RF model trained on stratified random samples from K-means classifier.
References
Thierry Ranchin and Lucien Wald. Data Fusion in Remote Sensing of Urban and Suburban Areas, pages 193–218. Springer Netherlands, Dordrecht, 2010. ISBN 978-1-4020-4385- 7. doi: 10:1007/978-1-4020-4385-7 11. URL https://doi.org/10.1007/978-1-4020-4385-7_11.
Y. Zou, G. Li and S. Wang, “The Fusion of Satellite and Unmanned Aerial Vehicle (UAV) Imagery for Improving Classification Performance,” IEEE International Conference on Information and Automation (ICIA), 2018, pp. 836-841, doi: 10.1109/ICInfA.2018.8812312.
Created 14th May 2021 Copyright © Benson Kenduiywo, Inc. All rights reserved.