Crop mapping
Background
Information on spatial distribution of crops is an important step towards yield estimation. We need to know where the crops are before we estimate the yield in a given region. Ground mapping approaches like surveying are expensive and time intensive. Remote sensing offers an effective and efficient platform for mapping thanks to improved temporal and spatial resolutions. In this case we supplement optical data with UAV images for training sites collection, and image fusion for crop mapping.
For crop mapping we use two different classification algorithms:
- Random Forests (RF) by Breiman 2001.
- Maximum Likelihood Classification (MLC).
Data preparation
Load libraries, declare variables and data paths.
rm(list=ls(all=TRUE))    #Clears R memory
unlink(".RData")
if (!require("pacman")) install.packages("pacman"); library(pacman)
p_load(raster, terra, randomForest, RStoolbox, tictoc)

options(warn=1)
cat("Set variables and start processing\n")
## Set variables and start processingRoot <- 'D:/JKUAT/RESEARCH_Projects/Eswatini/Data/'
Path_out <- paste0(Root,"Output/")Load Mpolonjeni UAV images for mission 1–5 and Sentinel 2. We will mosaic the UAV images to one image at 1 m spatial resolution and save to disk later. Once this is done we skip this process every other time we run the script.
#Sentinel 2
path <- list.files(paste0(Root,'S2/interim/'),pattern = (".tif$"), recursive = TRUE, full.names = TRUE)
s <- rast(path)
names(s) <- c("b", "g","r", "nir")
s
## class : SpatRaster
## dimensions : 10980, 10980, 4 (nrow, ncol, nlyr)
## resolution : 10, 10 (x, y)
## extent : 3e+05, 409800, 6990220, 7100020 (xmin, xmax, ymin, ymax)
## coord. ref. : +proj=utm +zone=36 +south +datum=WGS84 +units=m +no_defs
## sources : RT_T36JUR_20210418T073611_B02.tif
## RT_T36JUR_20210418T073611_B03.tif
## RT_T36JUR_20210418T073611_B04.tif
## ... and 1 more source(s)
## names : b, g, r, nir#UAV
mosaicname <- paste0(Path_out,'Mpolonjeni_W1_Mosaic.tif')
if(!file.exists(mosaicname)){
folders <- list.dirs(paste0(Root,'WingtraOne/Mpolonjeni'),recursive=TRUE)[-1]
folders
for (i in 1:length(folders)) {
path <- list.files(folders[i], pattern = (".tif$"))
# Remove all before and up to "reflectance_" in gsub
path <- path[order(gsub(".*reflectance_","",path))][-4]
#reorder the bands to match those in S2
paths <- path
paths[3] <- path[4]
paths[4] <- path[3]
temp <- rast(paste0(folders[i],"/",paths))
names(temp) <- c("b", "g", "r", "nir")
assign(paste0("v", i), temp)
}
}else{
v <- rast(mosaicname)
}We now have all the image missions loaded from corresponding sub-folders, stacked, and dynamically allocated variables i.e. \(\text{v1},\text{v2},\dots,\text{v5}\). Resample all the images to 1 m spatial resolution using bilinear approach and mosaic them.
if(!file.exists(mosaicname)){
  temp <- aggregate(v1[[1]], 9)
  res(temp) <- c(1, 1)
  v1 <- resample(v1, temp, method='bilinear')
  temp <- aggregate(v2[[1]], 9)
  res(temp) <- c(1, 1)
  v2 <- resample(v2, temp, method='bilinear')
  temp <- aggregate(v3[[1]], 9)
  res(temp) <- c(1, 1)
  v3 <- resample(v3, temp, method='bilinear')
  temp <- aggregate(v4[[1]], 9)
  res(temp) <- c(1, 1)
  v4 <- resample(v4, temp, method='bilinear')
  temp <- aggregate(v5[[1]], 9)
  res(temp) <- c(1, 1)
  v5 <- resample(v5, temp, method='bilinear')
}
Let’s now mosaic the scenes to form one image. We will use median to average out the overlaps. Median is preferred because it has been shown to be robust to outliers compared to the mean.
if(!file.exists(mosaicname)){
  v <- mosaic(v1, v2, v3, v4, v5, fun="median")
}
Save the mosaic to disk.
mosaicname <- paste0(Path_out,'Mpolonjeni_W1_Mosaic.tif')
if(!file.exists(mosaicname)){
  writeRaster(v, mosaicname)
}
Crop/clip Sentinel 2 image to UAV image extents.
s <- crop(s, ext(v), snap="near")Display the images side by side.
x11()
par(mfrow = c(1, 2)) #c(bottom, left, top, right)
plotRGB(s, r="nir", g="r", b="g", stretch="lin", axes=T, mar = c(4, 5, 1.4, 0.2), main="S2", cex.axis=0.5)
box()
plotRGB(v, r="nir", g="r", b="g", stretch="lin", axes=T, mar = c(4, 5, 1.4, 0.2), main="UAV", cex.axis=0.5)
box()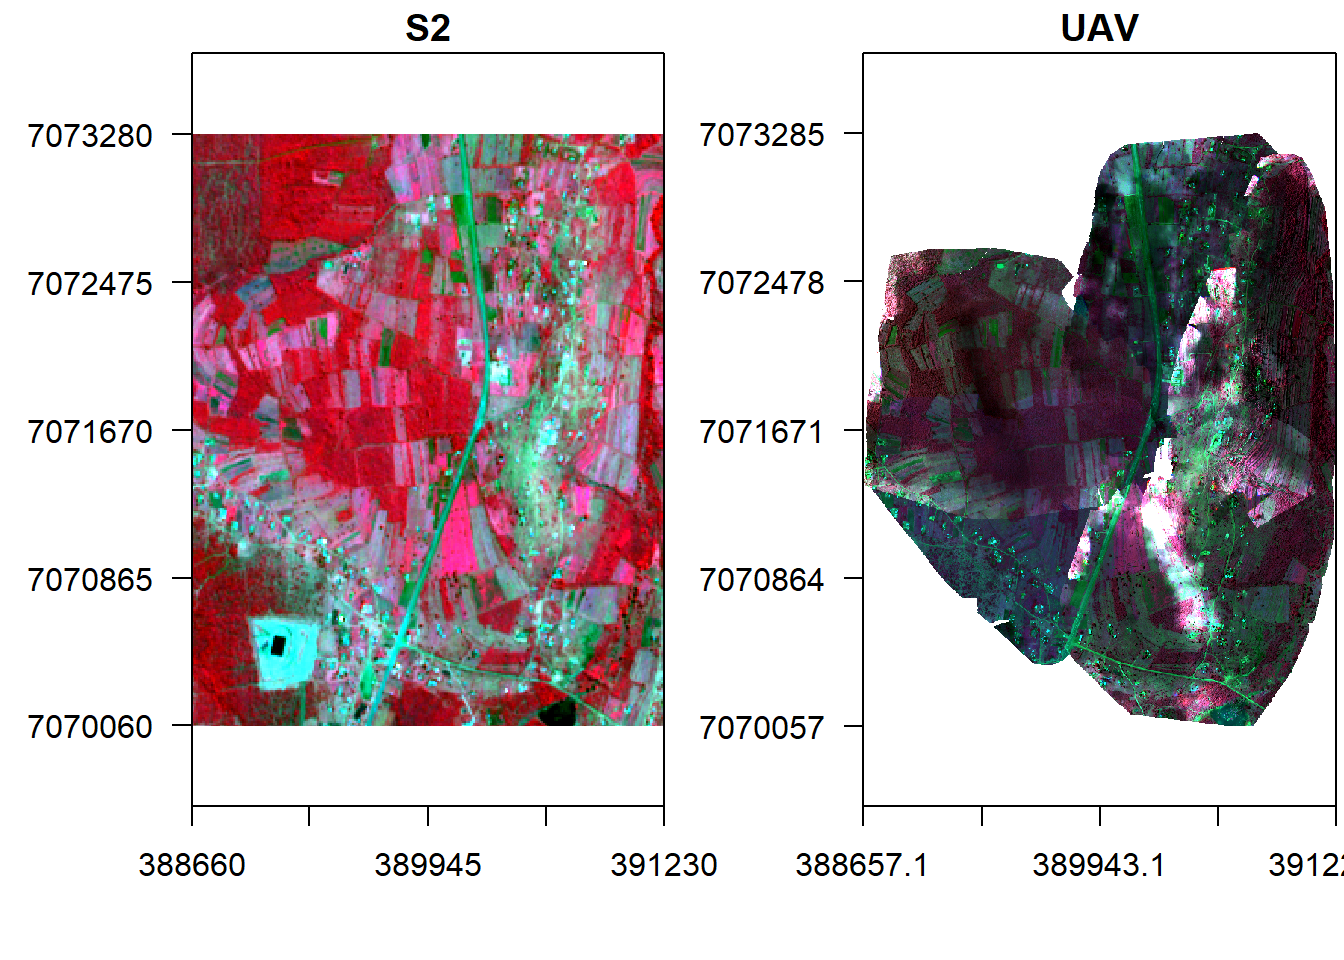
Training data sampling
Load train data.
#ref <- vect(paste0(Root,'Vector/Training_Sites_Mpolonjeni.shp'), "polygons")
ref  <- shapefile(paste0(Root,'Vector/Training_Sites_Mpolonjeni.shp'))
ref <- spTransform(ref, crs(v))
Sample points from the polygons (stratified random sampling).
set.seed(530)
samp <- spsample(ref, 4000, type='stratified')
## Warning in proj4string(obj): CRS object has comment, which is lost in output# add the land cover class to the points
samp$class <- over(samp, ref)$Name
samp$code <- over(samp, ref)$code
knitr::kable(table(samp$class), align = 'l')| Var1 | Freq |
|---|---|
| built_up | 734 |
| cassava | 109 |
| grass | 132 |
| maize | 749 |
| sorghum | 235 |
| sweet_potato | 738 |
| trees | 918 |
| waterbody | 368 |
sum(table(samp$class))## [1] 3983Declare the class names and their number.
#samp <- spTransform(samp, crs(v))
nClasses <- 8
Classes <- data.frame(classID=c(1:8),class=c('Built_up','Cassava', 'Grass',  'Maize',  'Sorghum', 'Sweet_potato','Trees','Water'))
Display S2 image and the training points.
add_legend <- function(...) {
  opar <- par(fig=c(0, 1, 0, 1), oma=c(0, 0, 0, 0),
    mar=c(0, 0, 0, 0), new=TRUE)
  on.exit(par(opar))
  plot(0, 0, type='n', bty='n', xaxt='n', yaxt='n')
  legend(...)
}

x11()
#par(mar = c(4, 4, 1.4, 0.1)) #c(bottom, left, top, right)
plotRGB(s, r="nir", g="r", b="g", stretch="lin", axes = TRUE, mar = c(4, 5, 1.4, 0.1))
#points(samp, col="blue", cex=.5)
lines(spTransform(ref, crs(s)), col="blue", lwd=1.5)
add_legend("bottom", legend="Reference data",
pch=c(0,15), col="blue", horiz=T, bty='n', cex=1.1)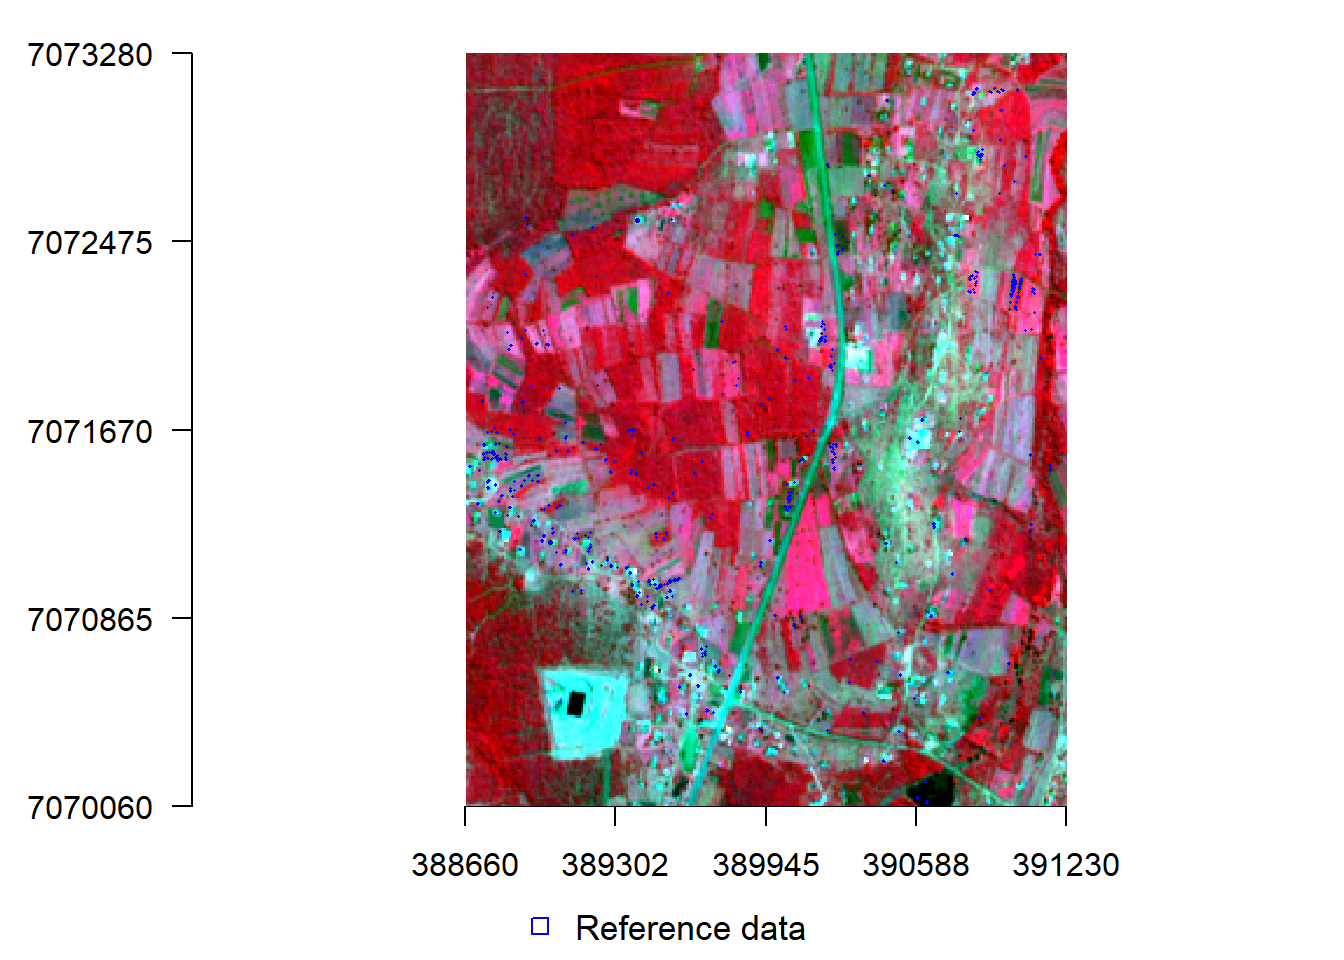
Extract UAV and S2 pixels values overlaid by points and split them into training and validation points.
#library(spatialEco)
trainData.v <- extract(brick(v), samp, cellnumbers=F, df=T, sp=T)
knitr::kable(head(trainData.v))| class | code | b | g | r | nir |
|---|---|---|---|---|---|
| waterbody | 8 | 0.0643933 | 0.0971735 | 0.1009569 | 0.0849024 |
| waterbody | 8 | 0.0642581 | 0.0969432 | 0.1003542 | 0.0865044 |
| waterbody | 8 | 0.0645692 | 0.0981981 | 0.1022022 | 0.0864920 |
| waterbody | 8 | 0.0633345 | 0.0975087 | 0.0983355 | 0.0855006 |
| waterbody | 8 | 0.0642581 | 0.0969432 | 0.1003542 | 0.0865044 |
| waterbody | 8 | 0.0642581 | 0.0969432 | 0.1003542 | 0.0865044 |
trainData.s <- extract(brick(s), samp, cellnumbers=F, df=T, sp=T)
knitr::kable(head(trainData.s))| class | code | b | g | r | nir |
|---|---|---|---|---|---|
| waterbody | 8 | 0.0228 | 0.0253 | 0.024 | 0.0227 |
| waterbody | 8 | 0.0228 | 0.0253 | 0.024 | 0.0227 |
| waterbody | 8 | 0.0228 | 0.0253 | 0.024 | 0.0227 |
| waterbody | 8 | 0.0228 | 0.0253 | 0.024 | 0.0227 |
| waterbody | 8 | 0.0228 | 0.0253 | 0.024 | 0.0227 |
| waterbody | 8 | 0.0228 | 0.0253 | 0.024 | 0.0227 |
library(caTools)
#(NB: 0.4 means 40% for training and 60% for validation)
labels <- as.data.frame(trainData.v[,1])
split <- sample.split(labels, SplitRatio = 0.4)
#UAV
valid.v <- subset(trainData.v, split == FALSE)
train.v <- subset(trainData.v, split == TRUE)
knitr::kable(table(train.v$class), align = 'l')| Var1 | Freq |
|---|---|
| built_up | 248 |
| cassava | 38 |
| grass | 43 |
| maize | 246 |
| sorghum | 77 |
| sweet_potato | 246 |
| trees | 307 |
| waterbody | 122 |
knitr::kable(table(valid.v$class), align = 'l')| Var1 | Freq |
|---|---|
| built_up | 486 |
| cassava | 71 |
| grass | 89 |
| maize | 503 |
| sorghum | 158 |
| sweet_potato | 492 |
| trees | 611 |
| waterbody | 246 |
#Sentinel 2
valid.s <- subset(trainData.s, split == FALSE)
train.s <- subset(trainData.s, split == TRUE)
knitr::kable(table(train.s$class), align = 'l')| Var1 | Freq |
|---|---|
| built_up | 248 |
| cassava | 38 |
| grass | 43 |
| maize | 246 |
| sorghum | 77 |
| sweet_potato | 246 |
| trees | 307 |
| waterbody | 122 |
knitr::kable(table(valid.s$class), align = 'l')| Var1 | Freq |
|---|---|
| built_up | 486 |
| cassava | 71 |
| grass | 89 |
| maize | 503 |
| sorghum | 158 |
| sweet_potato | 492 |
| trees | 611 |
| waterbody | 246 |
Maximum Likelihood Classification
Classify UAV and S2 image using MLC algorithm.
#UAV classification
mlc.uav <- superClass(brick(v), train.v[-2], responseCol = "class",
                model = "mlc", minDist = 1)
val.uav <- validateMap(mlc.uav$map, valid.v[-2], responseCol="class", mode='classification',
classMapping = mlc.uav$classMapping)
#Sentinel 2 classification
mlc.s <- superClass(brick(s), train.s, responseCol = "class",
                model = "mlc", minDist = 1)
val.s <- validateMap(mlc.s$map, valid.s, responseCol="class", mode='classification',
classMapping = mlc.s$classMapping)
Make a function to display classified images and use it to display the MLC map.
display <- function(map, method, nClasses){
    x11()
    par(mar = c(7, 2, 1.6, 6)) #c(bottom, left, top, right)
    image(map, col=c("red", "orange", "cyan" , "yellow", "brown", "magenta", "green1","blue"), axes=T, ann=F)
    classes.Palette <- colorRampPalette(c("red", "orange", "cyan" , "yellow", "brown", "magenta", "green1","blue", "white"))
    add_legend("bottom", legend=c('Built_up','Cassava', 'Grass',
'Maize',  'Sorghum', 'Sweet_potato','Trees','Water', "No data"), fill=classes.Palette(nClasses+1), ncol=3, bty='n', cex=1.1,  pt.bg = NA)
    title(paste0(method," Classification"))
}
display(mlc.uav$map, "UAV MLC", nClasses)
display(mlc.s$map, "S2 MLC", nClasses)
Lets design a function for accuracy assessment.
accuracy <- function(val.test){
    assessment.storage <- val.test$performance
    #print(assessment.storage)
    list_of_datasets <- list("ConfusionMatrix" = as.matrix(assessment.storage$table),
                    "OverallAcc" = as.matrix(assessment.storage$overall),
                    "byClass" = as.matrix(assessment.storage$byClass))
    return(list_of_datasets)
}
Assess the accuracy of MLC.
print('UAV Confusion matrixs')## [1] "UAV Confusion matrixs"List.v <- accuracy(val.uav)
knitr::kable(List.v$ConfusionMatrix,align='l')| built_up | cassava | grass | maize | sorghum | sweet_potato | trees | waterbody | |
|---|---|---|---|---|---|---|---|---|
| built_up | 268 | 0 | 0 | 0 | 0 | 0 | 1 | 0 |
| cassava | 0 | 39 | 0 | 0 | 0 | 0 | 0 | 0 |
| grass | 1 | 0 | 56 | 22 | 0 | 0 | 5 | 0 |
| maize | 13 | 0 | 2 | 233 | 6 | 0 | 6 | 4 |
| sorghum | 0 | 0 | 0 | 5 | 70 | 0 | 3 | 0 |
| sweet_potato | 0 | 0 | 0 | 0 | 0 | 239 | 0 | 0 |
| trees | 0 | 0 | 2 | 3 | 1 | 2 | 352 | 0 |
| waterbody | 0 | 0 | 0 | 0 | 0 | 0 | 0 | 109 |
print('S2 Confusion matrixs')## [1] "S2 Confusion matrixs"List.s <- accuracy(val.s)
knitr::kable(List.s$ConfusionMatrix,align='l')| built_up | cassava | grass | maize | sorghum | sweet_potato | trees | waterbody | |
|---|---|---|---|---|---|---|---|---|
| built_up | 67 | 0 | 2 | 2 | 0 | 0 | 2 | 0 |
| cassava | 0 | 8 | 0 | 0 | 0 | 0 | 0 | 0 |
| grass | 3 | 0 | 12 | 5 | 0 | 0 | 4 | 0 |
| maize | 4 | 0 | 8 | 29 | 2 | 0 | 7 | 0 |
| sorghum | 3 | 0 | 1 | 4 | 6 | 0 | 5 | 0 |
| sweet_potato | 0 | 0 | 0 | 0 | 0 | 14 | 3 | 0 |
| trees | 0 | 0 | 0 | 1 | 1 | 0 | 112 | 0 |
| waterbody | 0 | 0 | 0 | 0 | 0 | 0 | 0 | 8 |
print('Other accuracy measures')## [1] "Other accuracy measures"knitr::kable(data.frame(Type=List.v$OverallAcc[,0], UAV=round(List.v$OverallAcc[,1],3),S2=round(List.s$OverallAcc[,1],3)),align='l')| UAV | S2 | |
|---|---|---|
| Accuracy | 0.947 | 0.818 |
| Kappa | 0.936 | 0.759 |
| AccuracyLower | 0.934 | 0.771 |
| AccuracyUpper | 0.958 | 0.859 |
| AccuracyNull | 0.255 | 0.425 |
| AccuracyPValue | 0.000 | 0.000 |
| McnemarPValue | NaN | NaN |
knitr::kable(data.frame(UAV_F1score=round(List.v$byClass[,'F1'],3),S2_F1score=round(List.s$byClass[,'F1'],3)),align='l')| UAV_F1score | S2_F1score | |
|---|---|---|
| Class: built_up | 0.973 | 0.893 |
| Class: cassava | 1.000 | 1.000 |
| Class: grass | 0.778 | 0.511 |
| Class: maize | 0.884 | 0.637 |
| Class: sorghum | 0.903 | 0.429 |
| Class: sweet_potato | 0.996 | 0.903 |
| Class: trees | 0.968 | 0.907 |
| Class: waterbody | 0.982 | 1.000 |
knitr::kable(data.frame(UAV_UserAcc=round(List.v$byClass[,'Precision'],3),S2_UserAcc=round(List.s$byClass[,'Precision'],3)),align='l')| UAV_UserAcc | S2_UserAcc | |
|---|---|---|
| Class: built_up | 0.996 | 0.918 |
| Class: cassava | 1.000 | 1.000 |
| Class: grass | 0.667 | 0.500 |
| Class: maize | 0.883 | 0.580 |
| Class: sorghum | 0.897 | 0.316 |
| Class: sweet_potato | 1.000 | 0.824 |
| Class: trees | 0.978 | 0.982 |
| Class: waterbody | 1.000 | 1.000 |
knitr::kable(data.frame(UAV_ProducerAcc=round(List.v$byClass[,'Sensitivity'],3),S2_ProducerAcc=round(List.s$byClass[,'Sensitivity'],3)),align='l')| UAV_ProducerAcc | S2_ProducerAcc | |
|---|---|---|
| Class: built_up | 0.950 | 0.870 |
| Class: cassava | 1.000 | 1.000 |
| Class: grass | 0.933 | 0.522 |
| Class: maize | 0.886 | 0.707 |
| Class: sorghum | 0.909 | 0.667 |
| Class: sweet_potato | 0.992 | 1.000 |
| Class: trees | 0.959 | 0.842 |
| Class: waterbody | 0.965 | 1.000 |
Generally UAV gives better accuracy in most classes except for cassava and maize where Sentinel 2 performs well as observed from F1-score. However, the big question is will fusion improve accuracy? Let’s consider a mean fusion approach using random forest predicted/simulated high Sentinel based donwsampled Sentinel 2 data and UAV.
Downsample S2 to UAV 1 m spatial resolution using bilinear.
s_r <- resample(s,v,method="bilinear")Now sample points from UAV MLC land-cover RF regression prediction.
set.seed(530)
points <- spatSample(rast(mlc.uav$map), 3000, "stratified", as.points=T, na.rm=T, values=F)
Use the stratified randomly sample points to train and predict simulated high resolution S2.
s2_p <- extract(s_r, points, drop=F)
knitr::kable(head(s2_p), align = 'l')| ID | b | g | r | nir |
|---|---|---|---|---|
| 1 | 0.0393197 | 0.0602216 | 0.0562606 | 0.2464113 |
| 2 | 0.0276525 | 0.0408229 | 0.0302760 | 0.2619595 |
| 3 | 0.0280685 | 0.0393812 | 0.0301973 | 0.2556855 |
| 4 | 0.0348108 | 0.0508313 | 0.0501398 | 0.2338444 |
| 5 | 0.0391453 | 0.0599790 | 0.0634117 | 0.2391077 |
| 6 | 0.0391183 | 0.0577873 | 0.0638365 | 0.2426294 |
vr_p <- extract(v, points, drop=F)
knitr::kable(head(vr_p), align = 'l')| ID | b | g | r | nir |
|---|---|---|---|---|
| 1 | 0.2226881 | 0.3732991 | 0.2850645 | 2.9043691 |
| 2 | 0.0852571 | 0.1152778 | 0.0861861 | 1.2984504 |
| 3 | 0.0484837 | 0.0587416 | 0.0480554 | 0.6412777 |
| 4 | 0.0290400 | 0.0369230 | 0.0264030 | 0.5202775 |
| 5 | 0.0428044 | 0.0602511 | 0.0645384 | 0.4539916 |
| 6 | 0.0479790 | 0.0618544 | 0.0807158 | 0.4839757 |
data <- data.frame(S2=s2_p[,-1], UAV=vr_p[,-1])
library(randomForest)
#S2 predicted high resolution output name
s2h_name <- paste0(Path_out,'Mpolonjeni_S2_higres_Prediction.tif')
if(!file.exists(s2h_name)){
  UAV <- rast(mosaicname)
  names(UAV) <- c("UAV.b", "UAV.g", "UAV.r", "UAV.nir")
  startTime <- Sys.time()
  cat("Start time", format(startTime),"\n")
    s2h.b <- predict(UAV, randomForest(S2.b~UAV.b, data=data, ntree = 300), na.rm=T)
    s2h.g <- predict(UAV, randomForest(S2.g~UAV.g, data=data, ntree = 300), na.rm=T)
    s2h.r <- predict(UAV, randomForest(S2.r~UAV.r, data=data, ntree = 300), na.rm=T)
    s2h.nir <- predict(UAV, randomForest(S2.nir~UAV.nir, data=data, ntree = 300), na.rm=T)
  timeDiff <- Sys.time() - startTime
  cat("\n Processing time", format(timeDiff), "\n")
}
Stack all the S2 bands predictions.
if(!file.exists(s2h_name)){
  #Stack them
  s2h <- c(s2h.b,s2h.g,s2h.r,s2h.nir)
  names(s2h) <- c("b", "g","r", "nir")
  s2h
  writeRaster(s2h, s2h_name)
}else{
  s2h <- rast(s2h_name)
}
Fuse the simulated S2 high resolution image with UAV using median.
s2h.fused <- v
s2h.fused <- mean(s2h, v)
s2h.fused
## class : SpatRaster
## dimensions : 3228, 2572, 4 (nrow, ncol, nlyr)
## resolution : 1, 1 (x, y)
## extent : 388657.1, 391229.1, 7070057, 7073285 (xmin, xmax, ymin, ymax)
## coord. ref. : +proj=utm +zone=36 +south +datum=WGS84 +units=m +no_defs
## source : memory
## names : b, g, r, nir
## min values : 0.01521104, 0.02353837, 0.01816200, 0.04858300
## max values : 0.6900264, 0.9911296, 1.1898333, 4.2927577Classify and validate the fused product using MLC.
trainData.f <- extract(brick(s2h.fused), samp, cellnumbers=F, df=T, sp=T)
knitr::kable(head(trainData.f), align = 'l')| class | code | b | g | r | nir |
|---|---|---|---|---|---|
| waterbody | 8 | 0.0528547 | 0.0758793 | 0.0783905 | 0.0715046 |
| waterbody | 8 | 0.0526525 | 0.0657366 | 0.0807126 | 0.0732824 |
| waterbody | 8 | 0.0491812 | 0.0733447 | 0.0792717 | 0.0732762 |
| waterbody | 8 | 0.0498265 | 0.0749694 | 0.0791994 | 0.0718037 |
| waterbody | 8 | 0.0526525 | 0.0657366 | 0.0807126 | 0.0732824 |
| waterbody | 8 | 0.0526525 | 0.0657366 | 0.0807126 | 0.0732824 |
valid.f <- subset(trainData.f, split == FALSE)
train.f <- subset(trainData.f, split == TRUE)

mlc.f <- superClass(brick(s2h.fused), train.f, responseCol = "class",
                model = "mlc", minDist = 1)
val.f <- validateMap(mlc.f$map, valid.f, responseCol="class", mode='classification',  classMapping = mlc.f$classMapping)

display(mlc.f$map, "Fused MLC", nClasses)
Validate the fused MLC land-cover product.
List.f <- accuracy(val.f)
print('Accuracy measures comparison')
## [1] "Accuracy measures comparison"knitr::kable(data.frame(Type=List.v$OverallAcc[,0], UAV=round(List.v$OverallAcc[,1],3),S2=round(List.s$OverallAcc[,1],3),Fused=round(List.f$OverallAcc[,1],3)),align='l')| UAV | S2 | Fused | |
|---|---|---|---|
| Accuracy | 0.947 | 0.818 | 0.907 |
| Kappa | 0.936 | 0.759 | 0.888 |
| AccuracyLower | 0.934 | 0.771 | 0.891 |
| AccuracyUpper | 0.958 | 0.859 | 0.922 |
| AccuracyNull | 0.255 | 0.425 | 0.255 |
| AccuracyPValue | 0.000 | 0.000 | 0.000 |
| McnemarPValue | NaN | NaN | NaN |
knitr::kable(data.frame(UAV_F1score=round(List.v$byClass[,'F1'],3),S2_F1score=round(List.s$byClass[,'F1'],3),Fused_F1score=round(List.f$byClass[,'F1'],3)),align='l')| UAV_F1score | S2_F1score | Fused_F1score | |
|---|---|---|---|
| Class: built_up | 0.973 | 0.893 | 0.976 |
| Class: cassava | 1.000 | 1.000 | 0.925 |
| Class: grass | 0.778 | 0.511 | 0.750 |
| Class: maize | 0.884 | 0.637 | 0.810 |
| Class: sorghum | 0.903 | 0.429 | 0.733 |
| Class: sweet_potato | 0.996 | 0.903 | 0.975 |
| Class: trees | 0.968 | 0.907 | 0.922 |
| Class: waterbody | 0.982 | 1.000 | 1.000 |
knitr::kable(data.frame(UAV_UserAcc=round(List.v$byClass[,'Precision'],3),S2_UserAcc=round(List.s$byClass[,'Precision'],3),Fused_UserAcc=round(List.f$byClass[,'Precision'],3)),align='l')| UAV_UserAcc | S2_UserAcc | Fused_UserAcc | |
|---|---|---|---|
| Class: built_up | 0.996 | 0.918 | 0.996 |
| Class: cassava | 1.000 | 1.000 | 0.902 |
| Class: grass | 0.667 | 0.500 | 0.643 |
| Class: maize | 0.883 | 0.580 | 0.853 |
| Class: sorghum | 0.897 | 0.316 | 0.614 |
| Class: sweet_potato | 1.000 | 0.824 | 0.979 |
| Class: trees | 0.978 | 0.982 | 0.956 |
| Class: waterbody | 1.000 | 1.000 | 1.000 |
knitr::kable(data.frame(UAV_ProducerAcc=round(List.v$byClass[,'Sensitivity'],3),S2_ProducerAcc=round(List.s$byClass[,'Sensitivity'],3), Fused_ProducerAcc=round(List.f$byClass[,'Sensitivity'],3)), align = 'l')| UAV_ProducerAcc | S2_ProducerAcc | Fused_ProducerAcc | |
|---|---|---|---|
| Class: built_up | 0.950 | 0.870 | 0.957 |
| Class: cassava | 1.000 | 1.000 | 0.949 |
| Class: grass | 0.933 | 0.522 | 0.900 |
| Class: maize | 0.886 | 0.707 | 0.772 |
| Class: sorghum | 0.909 | 0.667 | 0.909 |
| Class: sweet_potato | 0.992 | 1.000 | 0.971 |
| Class: trees | 0.959 | 0.842 | 0.891 |
| Class: waterbody | 0.965 | 1.000 | 1.000 |
It is clear that fusion improved mapping accuracy of some crops and was definitely better than S2 classification. Do we probably need a better framework to reap the benefits fo fusion? Lets try another classification method.
Random Forest (RF)
Use RF to classify the images (UAV, S2 and fused image) and compare crop mapping accuracy with MLC. Firsts, we evaluate model training using plots of training error and variable importance. Note: the most important variable is one which has the highest increase in Mean Standard Error (MSE) when removed from the model training samples. We explore these plots using the PCA fused image as an example. From Figure @ref(fig:rf1), the training error reduces with increase in number of trees. We set the number of trees to 250 because it has been established that over 200 trees RF estimates are stable (Hastie, Tibshirani, and Friedman 2011).
rf.pca <- randomForest(code~., data=na.omit(as.data.frame(train.f[,-1]@data)), ntree = 250, importance=T)
plot(rf.pca, main='RF Training Error')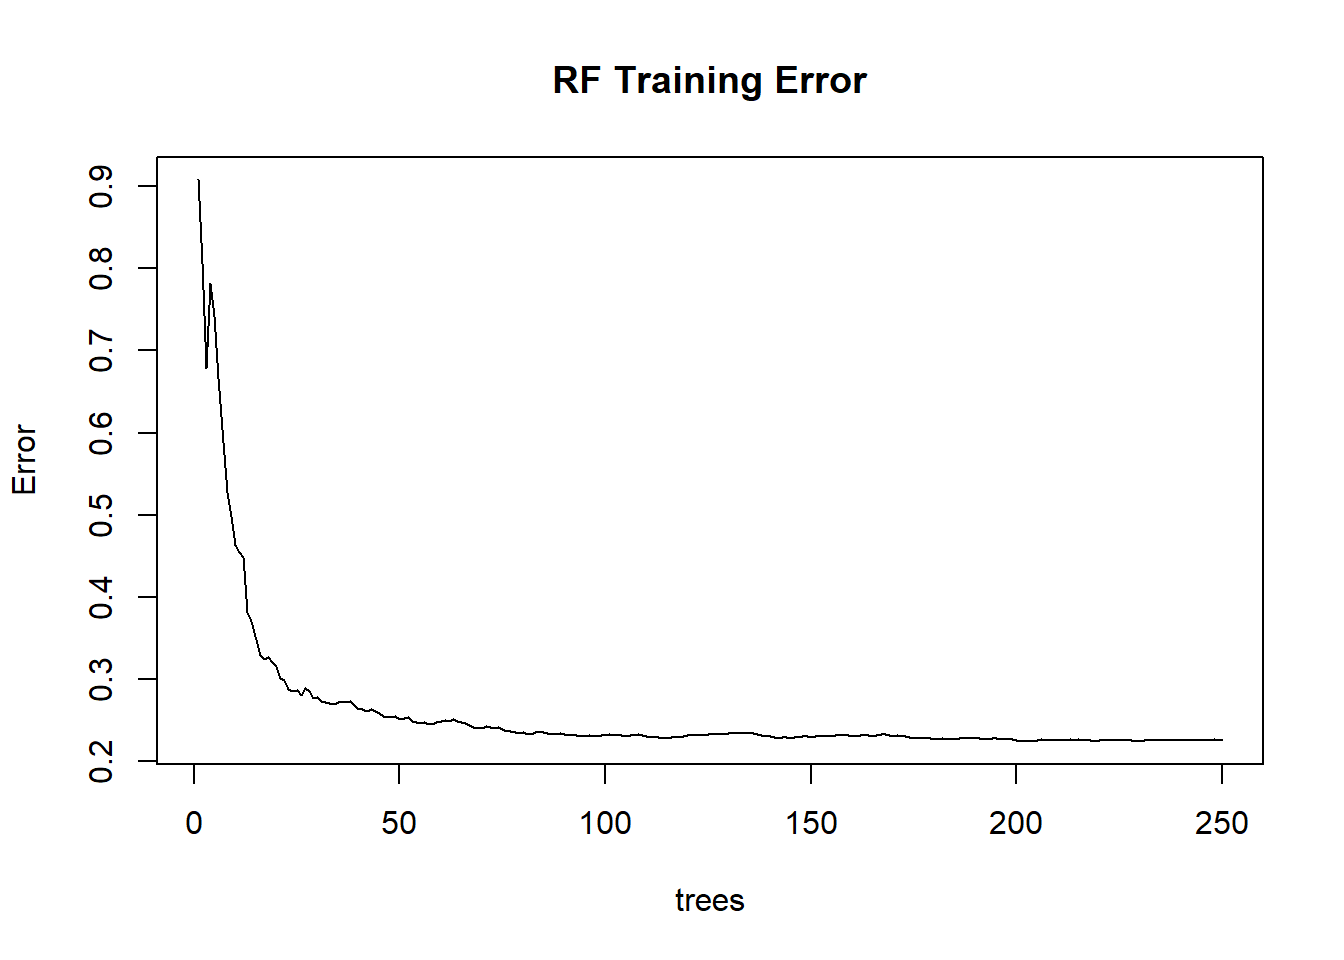
F Training Error w.r.t number of trees.
#knitr::kable(importance(rf.pca))varImpPlot(rf.pca,sort=TRUE, n.var=min(dim(s2h.fused)[3], nrow(rf.pca$importance)), type = 1)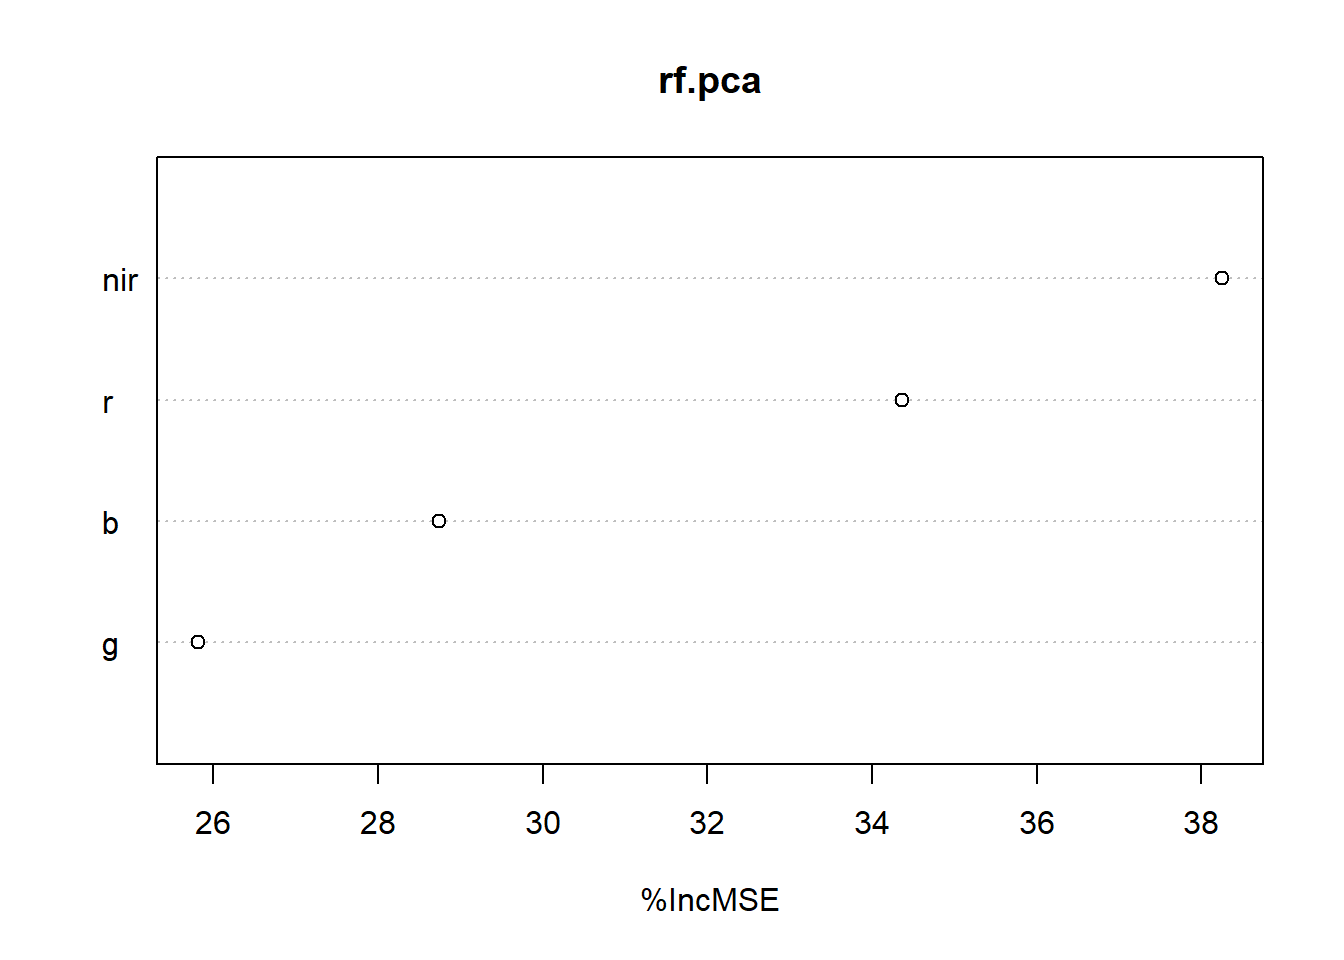
RF Variable importance b ased on mean decrease in MSE.
Mean Decrease Gini (IncNodePurity) - This is a measure of variable importance based on the Gini impurity index (i.e. node purity) used for the calculating the splits in trees. The higher the value of mean decrease accuracy or mean decrease gini score, the higher the importance of the variable to our model.
Estimate crop probabilities and map using RF. We will later use the probabilities in a conditional/markov random fields (CRFs/MRFs) classification framework which considers spatial context.
tic("RF mapping duration:")
rf.f.map <- superClass(brick(s2h.fused), train.f, responseCol = "class",
                model = "rf")
toc()
## RF mapping duration:: 149.52 sec elapsedtic("RF probabilities duration:")
rf.f.prob <- superClass(brick(s2h.fused), train.f, responseCol = "class",
model = "rf", predType="prob")
toc()## RF probabilities duration:: 160.81 sec elapsed#Display RF map.
display(rf.f.map$map, "Fused RF", nClasses)Validate RF fused map using F1-score and compare it with MLC fusion.
val.rf.f <- validateMap(rf.f.map$map, valid.f, responseCol="code", mode='classification')

List.rf.f <- accuracy(val.rf.f)
knitr::kable(data.frame(RFfused=round(List.rf.f$byClass[,'F1'],3),
MLCfused=round(List.f$byClass[,'F1'],3)), align='l', caption = 'F1-score')| RFfused | MLCfused | |
|---|---|---|
| Class: 1 | 0.986 | 0.976 |
| Class: 2 | 0.949 | 0.925 |
| Class: 3 | 0.857 | 0.750 |
| Class: 4 | 0.932 | 0.810 |
| Class: 5 | 0.917 | 0.733 |
| Class: 6 | 0.982 | 0.975 |
| Class: 7 | 0.966 | 0.922 |
| Class: 8 | 1.000 | 1.000 |
RF gives a better accuracy on the fused product compared to MLC.
MRF
Markov Random Fields (MRFs) and Conditional Random Fields (CRFs) techniques are one of the commonly used contextual classification methods. They offer a probabilistic framework that models spatial dependencies of labels (MRFs) with additional dependencies in data in the case of CRFs in a classified image (Kenduiywo 2016).
#Load CRF/MRF function
source(paste0("D:/Code/Sleek/CRF_MRF.R"))
WithRef     <- FALSE
beta0         <- 20
Nneighb     <- 4
bCRF          <- FALSE #If TRUE MOdel runs CRF

#Take care of NA mask
image <- brick(s2h.fused)
mrf_name <- paste0(Path_out,'Mpolonjeni_fused_MRF_map.tif')
if(!file.exists(mrf_name)){
  rf_MRF <- CRF_MRF(image, WithRef, beta0, Nneighb, rf.f.map$map, rf.f.prob$map, bCRF, nClasses)
  writeRaster(rf_MRF, mrf_name)
}else{
  rf_MRF <- brick(mrf_name)
}

display(rf_MRF, "Fused RF-MRF", nClasses)

val.mrf.f <- validateMap(rf_MRF, valid.f, responseCol="code", mode='classification')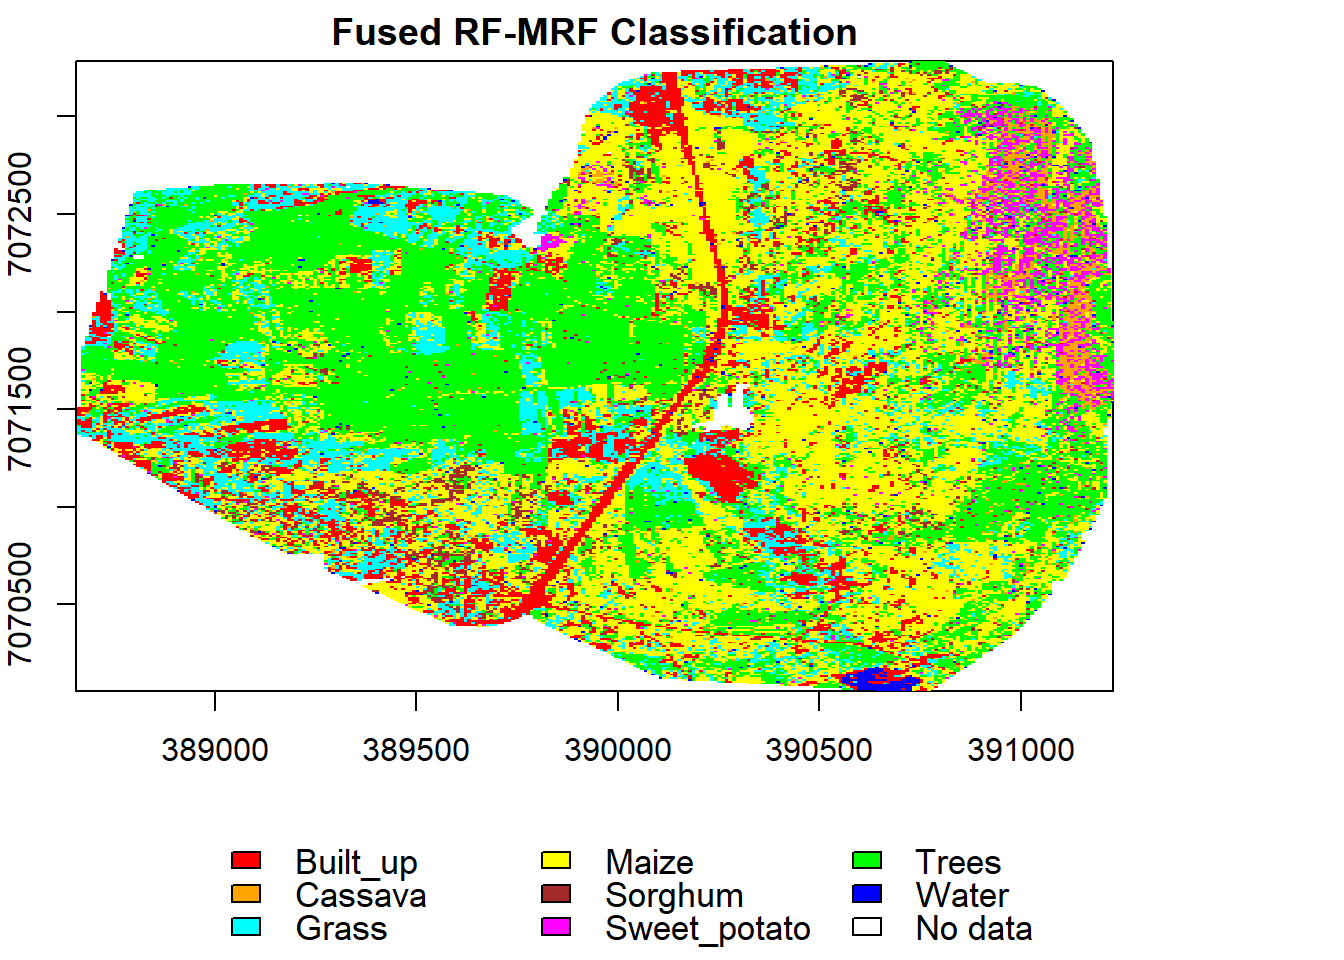
List.mrf.f <- accuracy(val.mrf.f)
knitr::kable(data.frame(MRFfused=round(List.mrf.f$byClass[,'F1'],3),RFfused=round(List.rf.f$byClass[,'F1'],3),
MLCfused=round(List.f$byClass[,'F1'],3)), align='l', caption = 'F1-score')| MRFfused | RFfused | MLCfused | |
|---|---|---|---|
| Class: 1 | 0.995 | 0.986 | 0.976 |
| Class: 2 | 0.962 | 0.949 | 0.925 |
| Class: 3 | 0.887 | 0.857 | 0.750 |
| Class: 4 | 0.968 | 0.932 | 0.810 |
| Class: 5 | 0.921 | 0.917 | 0.733 |
| Class: 6 | 0.992 | 0.982 | 0.975 |
| Class: 7 | 0.975 | 0.966 | 0.922 |
| Class: 8 | 0.996 | 1.000 | 1.000 |
References
Breiman, L. Random Forests. Machine Learning 45, 5–32 (2001). https://doi.org/10.1023/A:1010933404324
Y. Zou, G. Li and S. Wang, “The Fusion of Satellite and Unmanned Aerial Vehicle (UAV) Imagery for Improving Classification Performance,” IEEE International Conference on Information and Automation (ICIA), 2018, pp. 836-841, doi: 10.1109/ICInfA.2018.8812312.
Kenduiywo, B. Spatial-temporal Dynamic Conditional Random Fields crop type mapping using radar images. Technische Universitaet Darmstadt Prints (2016)
Created 14th May 2021 Copyright © Benson Kenduiywo, Inc. All rights reserved.